

 By
By Correlation With Bitcoin Is a Design Choice, Not a Curse
Every founder who has watched their token bleed through a good quarter has heard the same consolation: the whole market is down, there is nothing you can do, everything follows Bitcoin. It is a comfortable story because it moves the problem outside the building. It is also, for a meaningful set of protocols, wrong.
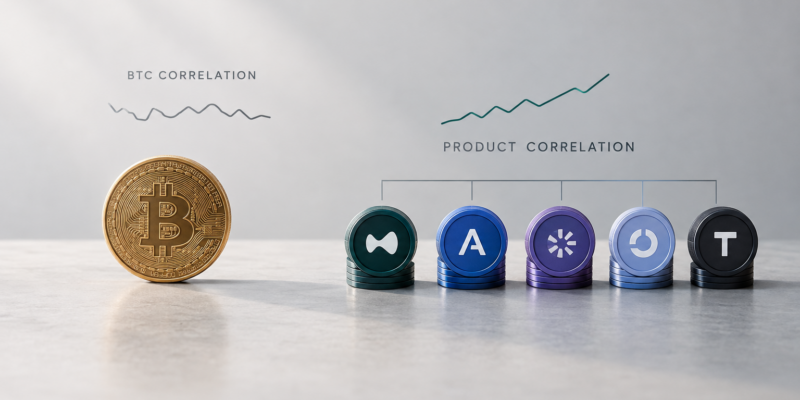
We ran the numbers on ten DeFi and AI protocols between October 2025 and May 2026, comparing daily percentage changes in token price against daily percentage changes in the protocol’s own product metric. Every single one of them showed a stronger statistical link to its own product than to BTC. The Pearson coefficients spread from 0.45 to 0.92 — and that spread is the interesting part, because it has almost nothing to do with which team built the better product.
All ten protocols make real money. What separates 0.45 from 0.92 is plumbing: how fast, how automatically, and how unavoidably that money reaches the person holding the token.
The spread is a spread in mechanics, not in quality
Start with the two cases that sit closest together in design and furthest apart in outcome.
Hyperliquid routes 99% of trading fees into buying HYPE on the open market. No proposal, no quorum, no treasury committee. Volume rises, fees rise, the contract buys. Correlation with protocol fees: roughly 0.90.
Sky — the protocol formerly known as MakerDAO — does something structurally similar. Surplus profit funds buybacks and burns; when collateral falls short, fresh SKY is minted and holders are diluted. Harsh, transparent, and genuinely tied to results. Correlation: roughly 0.65, near the bottom of our sample.
The difference is not the mechanic. It is the latency. Between “the protocol earned money” and “the holder felt it” Sky inserts a governance cycle. Markets do not price a delayed, discretionary, revocable claim the way they price an automatic one. Twenty-five basis points of correlation is what that governance step costs.
That is the first lesson for anyone still drafting a token model: each manual decision you place between revenue and holder is a discount applied to your own price.
The metric you choose is already an argument
Half the debates about whether a token “has fundamentals” are really debates about measurement. Transactions, wallets, active addresses and TVL are activity metrics. They can all go up while nobody pays for anything — which is precisely what incentive programs are for.
So the test has to run on something a human being paid money for. For Bittensor we deliberately used App Fees — actual payments for inference and model training — rather than the network’s transaction count, and got 0.68. For GMX, fees were the only series that showed organic usage once speculative noise was stripped out.
The filter is one sentence long: if your metric can rise without anyone paying, it cannot tell you anything about price.
Sell the token, lose the right
The strongest coefficients in the sample share a trait that ordinary staking does not provide. Selling costs you access to something with a market price — not a yield percentage, a right.
Curve tops the table at 0.92. Locking CRV into veCRV buys voting power over how emissions are distributed across pools, and the more volume a pool does, the more a vote directed at it is worth. That right became valuable enough that an entire multi-billion-dollar layer — Convex Finance — was built purely to aggregate and trade it. Aerodrome runs the same logic on Base: veAERO holders decide where rewards go, and projects that need liquidity pay them directly for the vote. Aave takes another route — AAVE staked in the Safety Module underwrites the protocol’s solvency in exchange for a share of borrower fees.
In all three cases, exiting during a drawdown means surrendering influence or income, not just changing your market exposure. That is what keeps a cap table in place when the chart looks bad and the product still works.
Where the honest answer is “yes, but”
A column that only celebrated the top of the table would be marketing. Four caveats sit right in the data.
Exchange-shaped businesses carry market beta by nature. GMX at 0.45 is the floor of our sample, and not because the model is broken: fees kept flowing, stakers kept getting paid in ETH and AVAX. But perpetuals volume is a function of market sentiment, so metric and price fall together for the same external reason. Read that as absent fundamentals and you have misread it — GMX has real yield, which is more than most of the market can claim. It also has no long-term lockup, so nothing rewards patience.
Complexity taxes adoption. Curve owns the best coefficient and the steepest learning curve in the sample: gauges, bribes, lock durations. Same for vePENDLE, same for the SNX → sUSD → synthetics chain. A tight link across an existing sophisticated audience is not the same asset as a growing audience.
Rights must be priced against risk. Aave’s Safety Module asks stakers to accept slashing exposure; the compensation does not always match the tail risk they are absorbing.
Mechanisms get captured. Under veAERO, a small holder’s vote barely moves the distribution. A system designed to involve a community ends up serving whales — technically working, strategically hollow.
The full sample
Calculations on DefiLlama data, October 2025 – May 2026. Full dataset and the cross-correlation matrix: https://8blocks.io/research/product-linked-tokens-correlation-study
Run it on your own token this week
The method is deliberately boring, which is why any team with a live product can reproduce it without hiring anyone.
- Pick one metric somebody pays for — fees, revenue, usage payments. Discard transaction counts and address counts.
- Correlate daily percentage changes, not absolute levels. Absolute series will hand you a flattering number that mostly reflects the market trend.
- Choose a window that contains a drawdown. Ours runs October 2025 to May 2026 specifically because it includes 10 October 2025, when US trade tariffs triggered the largest liquidation wave in crypto history. In a rising market, narrative and fundamentals are indistinguishable.
- Compute the same correlation against BTC and compare. The absolute coefficient matters far less than which of the two links is stronger.
- If the product link loses, the cause is almost always one of three: the token is optional inside the product, the value return depends on manual decisions, or your metric is itself a bet on the market.
None of this makes a token immune to a market-wide liquidation cascade; nothing does. What it changes is what happens afterwards. A token whose price is wired to paying demand recovers when demand recovers. A token whose only input is market sentiment recovers when sentiment does — which is another way of saying its team has no lever at all.
Bitcoin correlation, in other words, is not a life sentence. For most projects it is a design decision that was never made explicitly.
The data in this column comes from the 8Blocks study of product-linked tokens, covering 10 DeFi and AI protocols over October 2025 – May 2026. 8Blocks designs and reviews token economies; measuring the token-to-product link is the heaviest-weighted block in our tokenomics audit methodology.