


Bitcoin tests $63K as Saylor calls BTC digital energy
Bitcoin traded near $62,675 on July 5, according to crypto.news market data. The asset was up about 0.1% over 24 hours and 4.03% over seven days. Its market cap stood near $1.26 trillion, while 24-hour volume was about $17.57 billion.
Summary
- Bitcoin trades near $62,675 as traders test whether the weekly 200MA can still hold firm.
- Saylor’s “digital energy” post added a macro angle while technical analysts focused on resistance overhead.
- ETF inflows and short squeezes lifted sentiment, but weak volume keeps confirmation limited for now.
The latest 24-hour range showed Bitcoin moving between $62,462 and $63,383. That kept BTC close to the $63,000 area after a short-term rebound from the late-June low near $58,000 to $59,000.
Michael Saylor added to the wider market discussion with a short post on X, saying “Bitcoin is Digital Energy.” The comment came days after he argued that Bitcoin’s long-term role depends on capital markets, credit and institutional adoption.
Shorts cleared near $63K
Trader Daan Crypto Trades said Bitcoin shorts were cleared twice as price moved toward $63,000 on July 4. He called the move a “classic short squeeze,” where sellers are forced to close positions as price rises into a crowded short zone.
He also raised doubt over the next move, asking whether “$62.6K (Weekly 200MA) holds as support” or whether the move only cleared liquidity before another pullback. That level now sits near the center of the short-term Bitcoin debate.
Crypto.news reported that Bitcoin had already rebounded near $61,700 after U.S. spot Bitcoin ETF inflows returned. The report said BTC needed to reclaim $62,800 and $65,000 to confirm stronger bullish momentum.
That framework remains useful as price trades near $63,000. Holding above the weekly 200MA may support the recovery, while a failure could bring attention back to $60,000 and the late-June low area.
Falling wedge keeps breakout hopes alive
Analyst BATMAN said Bitcoin remains inside a daily falling wedge while the RSI shows a bullish divergence. In simple terms, price made lower lows, but momentum did not fall with the same force.
The analyst said this may show that bearish pressure is fading. He also pointed to the $67,500 to $71,000 area as a bearish imbalance above current price, where Bitcoin may seek liquidity if a confirmed breakout occurs.
The daily BTC/USDT setup shows a short-term recovery after the bounce from the $58,000 to $59,000 zone. The latest daily candle was slightly red near $62,700, showing hesitation after the rebound.
The Parabolic SAR sits below price near $58,126, which keeps the short-term structure supportive. A move below that area would weaken the recovery and bring sellers back into focus.
Momentum improves, but volume stays weak
The MACD has improved. The histogram is positive near 589.52, and the MACD line is above the signal line. This shows that bullish momentum has returned after the recent bounce.
Still, both MACD lines remain below the zero level. That means the wider trend has not fully turned bullish. It shows recovery momentum, not a confirmed trend change.
Volume also remains low at about 4.24K BTC on the chart reviewed. That limits confirmation behind the rebound. For a stronger move, Bitcoin would need higher volume and a clear break above the $63,000 to $65,000 resistance zone.
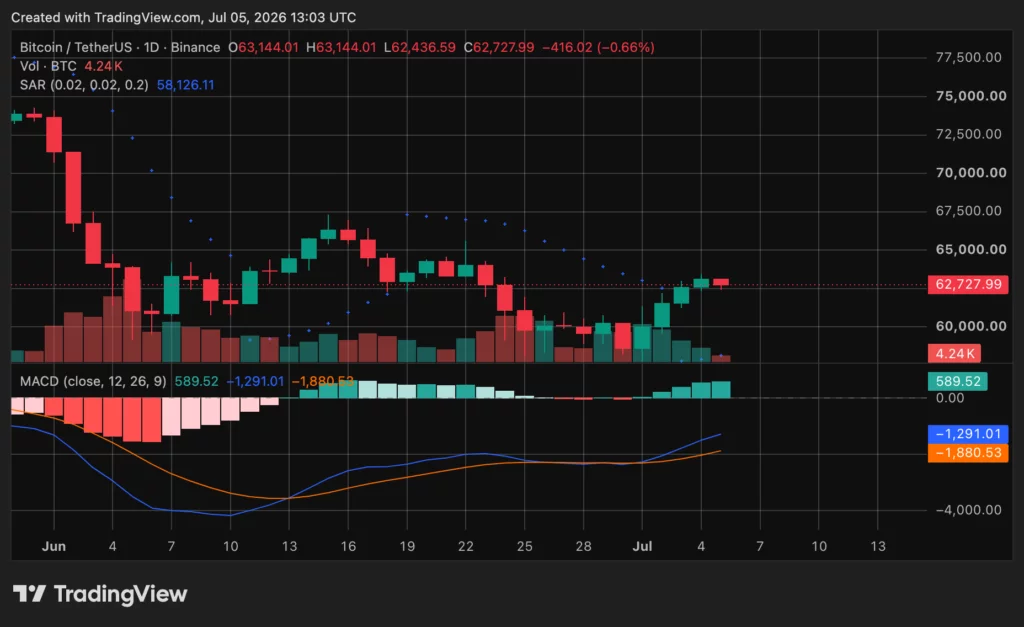
source: TradingView
The downside levels remain clear. Bitcoin must hold $62,600 to keep the short-term squeeze alive. Below that, traders may watch $60,000, then the $58,100 to $58,500 zone near the Parabolic SAR and recent lows.
Saylor’s Bitcoin view meets market caution
Saylor’s “digital energy” post fits his wider Bitcoin view. Crypto.news recently reported that Saylor has called for balance between adoption, innovation and stability as companies, banks and governments build around Bitcoin.
Crypto.news also reported that Saylor has argued Bitcoin’s old four-year cycle is losing control, with capital flows now shaping BTC more than miner issuance alone. That view places more weight on ETF flows, corporate treasury moves and credit markets.
For now, the market remains technical and cautious. Bitcoin has squeezed shorts and recovered from late-June lows, but it still needs a clean move above $65,000 to improve the broader chart.
Until that happens, the key test is simple. BTC must hold the weekly 200MA near $62,600, defend the $60,000 area, and attract stronger volume before traders can treat the rebound as more than a liquidity move.