

Shiba Inu price at risk of a crash as key metrics crumble
Shiba Inu’s price has already crashed by over 60% from its November highs, and both technical and fundamental factors point to further downside in the near term.
Summary
- Shiba Inu price has crashed by over 60% from its highest level in November.
- It has formed a bearish flag pattern, pointing to a strong bearish breakdown in the coming weeks.
- Top metrics like burn rate and Shibarium TVL have all plunged this year.
Shiba Inu price at risk as crucial metrics dip
Shiba Inu, the biggest meme coin on Ethereum (ETH) continues to experience weak metrics that puts its performance at risk.
Data compiled by Shibburn shows that the burn rate as dwindled in the past few days. It dropped by 72% on Tuesday, Aug. 12, to 181,928, which are equivalent to just $2.
Historically, SHIB price tends to perform better when the burn rate is rising, as reduced inflation boosts investor sentiment.
Shibarium, its layer-2 network, has also struggled to attract developers and investors. Its total value locked has fallen 10% in the past 30 days to $1.75 million, making it a minor player in an industry with a total TVL of nearly $300 billion.
Investor demand for Shiba Inu has weakened this year. Its 24-hour trading volume is $222 million, far below Dogecoin’s $1.7 billion and Pepe’s $698 million. Futures open interest has dropped to below $155 million.
Nansen data indicates that whales and smart money investors are no longer accumulating Shiba Inu. Whale holdings remain at 104.68 billion tokens, unchanged since July 21, while smart money holdings have fallen 22% in the past 30 days to 40.25 billion.

Whale and smart money holdings are important because these investors are considered more experienced and sophisticated than typical retail traders.
Shiba Inu’s weak performance is partly due to investors shifting toward newer meme coins, especially those in the Solana ecosystem, reducing demand for SHIB.
One positive note is that exchange supply has continued to decline this year, currently at 278 billion SHIB, down from last month’s high of 285 trillion.
Shiba Inu price technical analysis
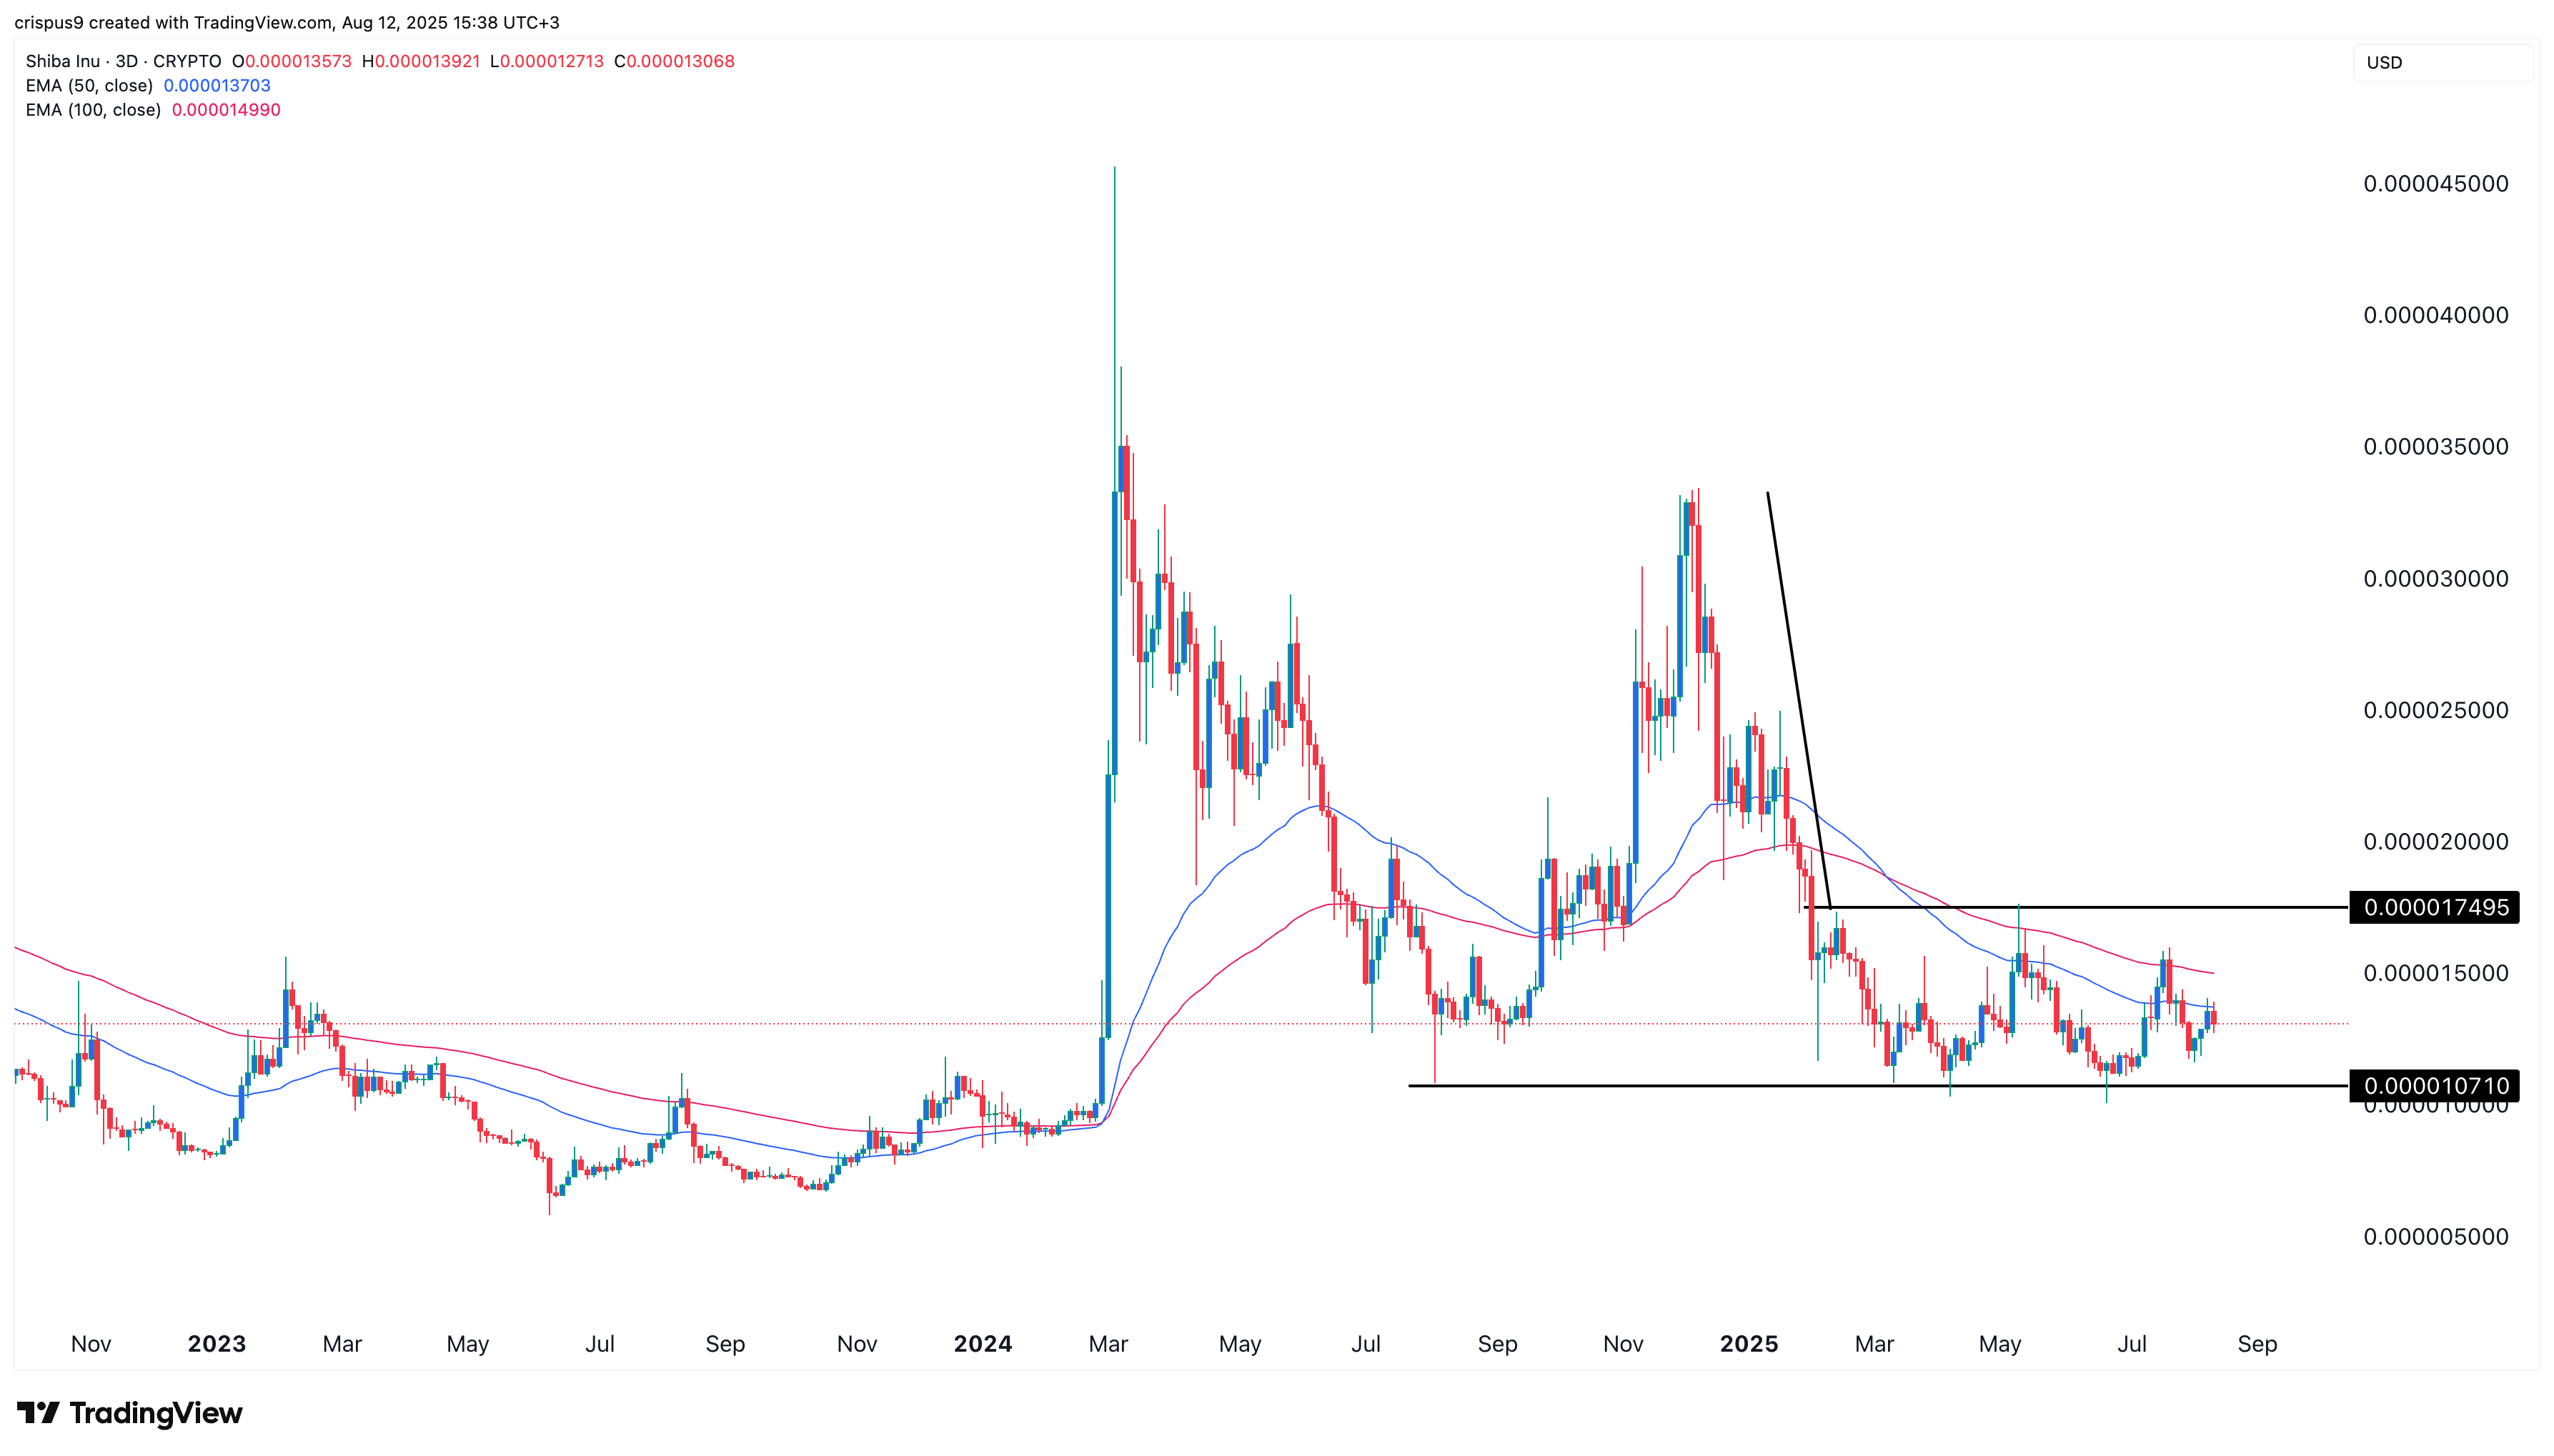
The three-day chart shows that SHIB has moved sideways since February, trading between support at $0.00001070 and resistance at $0.00001750.
The coin has formed a bearish flag pattern, consisting of a vertical decline followed by a horizontal channel.
SHIB has moved below the 50-day and 100-day Exponential Moving Averages, indicating that bears remain in control for now.
A bearish breakdown will be confirmed if SHIB falls below the lower side of the flag at $0.00001070. A drop under this support would signal more downside in the near term.