

Bitcoin price compresses at support, triangle pattern forms
The current Bitcoin price is consolidating at a key support level within a tightening triangle structure, signaling equilibrium as traders await a decisive breakout or continuation move.
Summary
- Bitcoin is forming a triangle pattern at major support levels.
- Declining volume indicates consolidation rather than a breakout.
- A confirmed breakout could target higher value and channel resistance.
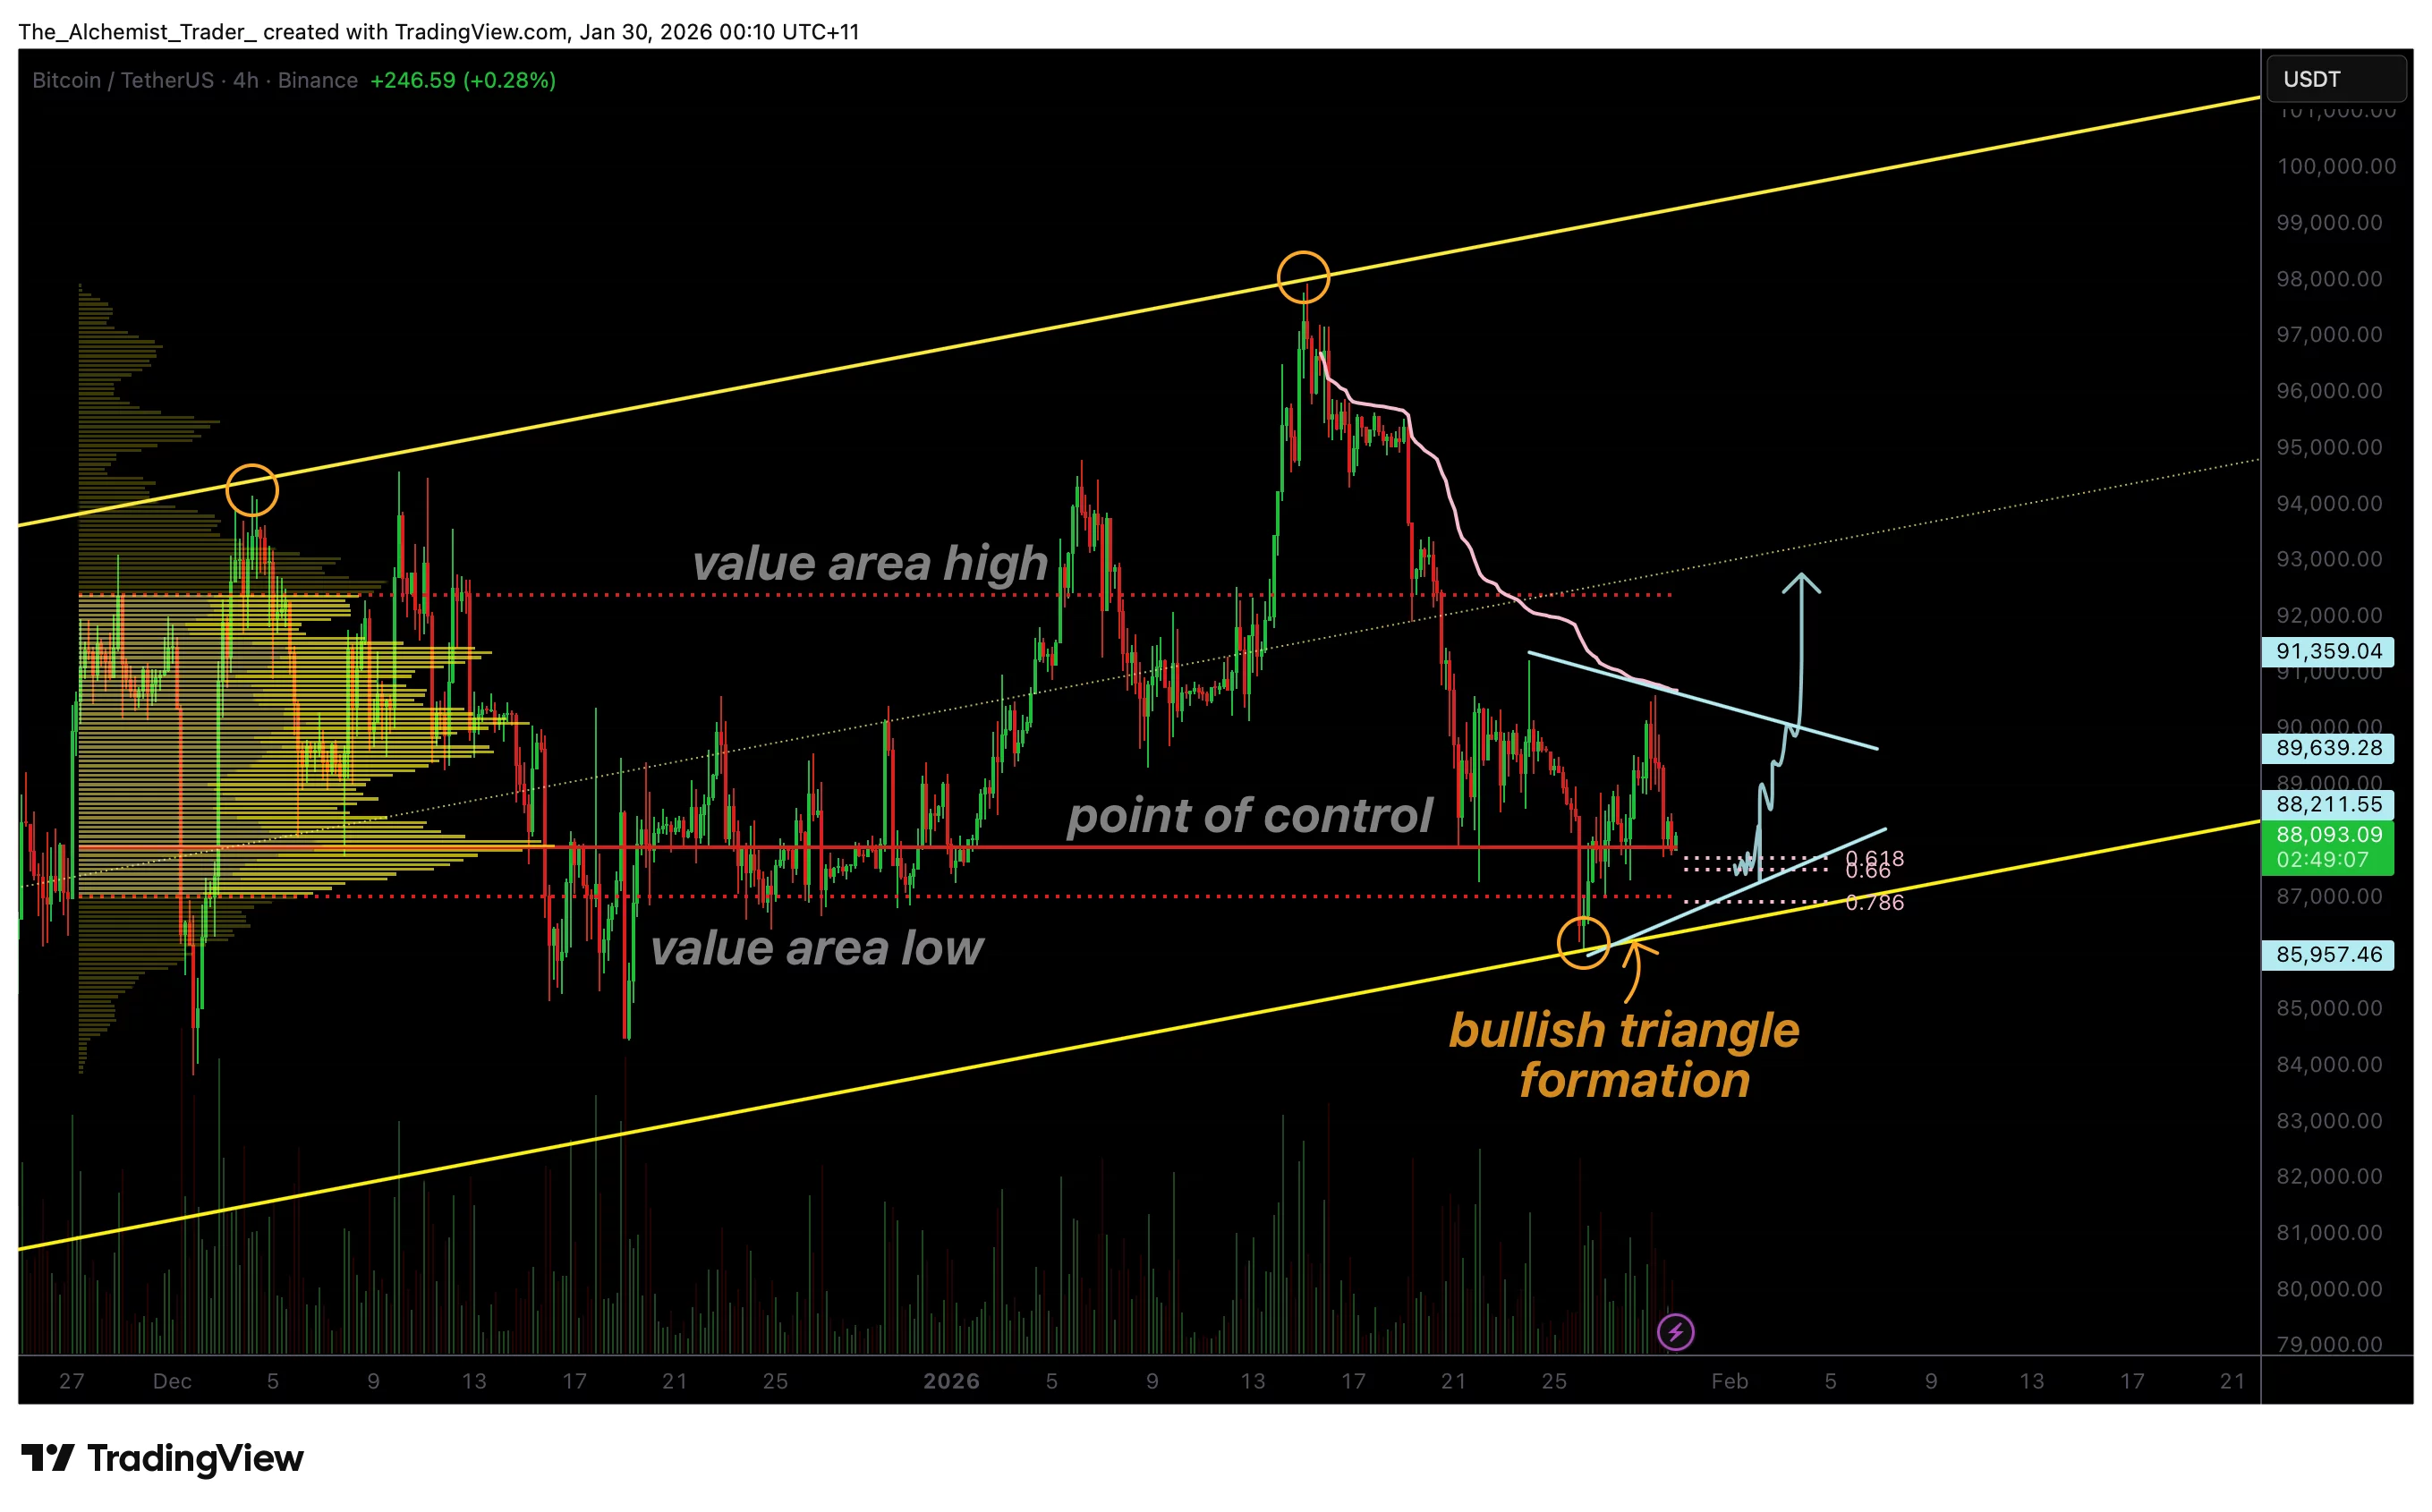
Bitcoin (BTC) price action has entered a technically important phase following a corrective move from recent highs. After establishing a local low at channel support, BTC staged a rally from the Monday open, suggesting short-term demand was present at lower levels.
However, that upside momentum has since slowed, with price rotating back into a zone of heavy technical confluence. This pause in momentum has led to a developing triangle formation, often associated with equilibrium conditions and eventual volatility expansion.
Bitcoin price key technical points
- Triangle structure developing at support: Signals compression and indecision.
- Point of control acting as a pivot: Confluence with value area low and Fibonacci support.
- Volume declining: Suggests consolidation rather than impulsive continuation.
The recent bounce from channel support marked an important short-term reaction, as buyers stepped in to defend lower prices. This rally carried Bitcoin higher before encountering resistance, prompting a controlled pullback rather than a sharp rejection. That behavior is notable, as it indicates sellers are not aggressively overwhelming demand.
Instead of breaking down, price has rotated into the point of control (POC), the level where the highest volume has traded during the current range. This area also aligns closely with the value area low and the 0.618 Fibonacci retracement, creating a technically dense zone that naturally encourages two-sided trading.
Triangle pattern reflects market equilibrium
As price compresses around this confluence zone, a triangle formation is beginning to take shape. Triangles typically form when neither buyers nor sellers have a clear advantage, leading to progressively lower highs and higher lows.
This type of structure reflects equilibrium, where market participants are waiting for confirmation before committing to direction.
Importantly, triangles are not inherently bullish or bearish. Their significance lies in the fact that they often precede volatility expansion, as prolonged compression tends to resolve with an impulsive move once one side gains control.
Declining volume supports consolidation thesis
Volume behavior adds further context to the setup. The volume profile has been declining during the formation of the triangle, a common characteristic of consolidation phases.
Falling volume suggests that aggressive participation is temporarily absent, reinforcing the idea that the market is coiling rather than trending.
This reduction in volume also indicates that the current move is not yet a breakout. True breakouts are typically accompanied by a sharp expansion in volume as new participants enter the market and existing positions are forced to adjust.
What confirms a bullish breakout?
For Bitcoin to resolve this triangle to the upside, strong bullish volume inflows will be required. A breakout that lacks volume confirmation is more likely to fail and revert back into the range.
Acceptance above the upper boundary of the triangle, followed by sustained trading, would be an early signal that buyers have regained control.
If such a breakout occurs, the next logical upside objectives would be the value area high and, beyond that, the upper boundary of the broader trading channel.
These levels represent areas where prior supply is likely to re-emerge and where continuation would need to be validated.
Reversal risk remains
While the structure favors a continuation scenario if a bullish breakout develops, the risk of a reversal cannot be ignored. Failure to hold the current support zone, particularly the POC and Fibonacci confluence, would weaken the bullish case.
A breakdown from the triangle suggests that the recent rally was corrective rather than impulsive, opening the door to renewed downside pressure.
At present, however, price remains supported, and no decisive breakdown signals have appeared.
From a broader market structure perspective, Bitcoin is currently in a neutral, range-bound state. The triangle formation reflects indecision rather than directional conviction. Until price breaks out with confirmation, traders are likely to see continued choppy conditions within a narrowing range.
Bitcoin price action: What to expect
Bitcoin is approaching a decision point as the triangle formation continues to compress. In the short term, consolidation is likely to persist while volume remains subdued. A bullish breakout, confirmed by expanding volume, would favor a rotation toward the value area high and channel resistance.
Conversely, a failure to hold current support would shift focus back toward lower levels. Until resolution occurs, patience remains key as the market prepares for its next directional move.