

Aave price holds bearish setup amid $27M liquidation error
Aave price is trading near $111 as traders react to a $27 million liquidation error that briefly shook confidence in the lending protocol.
Summary
- Aave price dropped after a $27M liquidation caused by a CAPO oracle error.
- 34 accounts using wstETH were liquidated, but the protocol stayed solvent and users will be reimbursed.
- AAVE trades in a descending channel with support at $110–$115, resistance at $125–$130, and weak momentum.
Aave (AAVE) slipped on Wednesday as traders reacted to a recent liquidation incident on the protocol. At press time, AAVE was trading at $111.45, down 2.2% over the past 24 hours.
During the past week, the token moved between $105.31 and $118.70. The price has attempted to recover from the February lows, but it has repeatedly stalled. The market has not yet returned to the levels observed prior to the earlier decline, and momentum is still weak.
Trading activity has cooled slightly. Daily trading volume reached about $29 million, which is 11% lower than the previous day. CoinGlass data also shows softer activity in derivatives markets. Futures volume fell 14% to $300 million, while open interest dropped 4.97% to $190 million.
When both volume and open interest fall at the same time, it usually means traders are stepping back and closing positions.
Liquidation glitch sparks concerns among traders
The decline in sentiment follows an unusual liquidation event on March 10 that affected several users of the Aave lending platform.
The incident was not caused by a hack or a sudden market crash. Instead, it stemmed from a configuration problem in CAPO, Aave’s internal risk management oracle used to monitor collateral prices.
The issue affected positions that used wstETH, the wrapped staked ether token issued by Lido, as collateral. A mismatch between an exchange-rate snapshot and its timestamp caused the system to read the wstETH-to-ETH price incorrectly.
Because of the error, the oracle undervalued the asset by roughly 2.85%. Several accounts suddenly appeared under-collateralized even though their positions were healthy on-chain.
As a result, around 34 user accounts were liquidated, and approximately 10,938 wstETH, worth about $27 million, was sold through automated liquidation processes. Liquidation bots earned close to 499 ETH through bonuses and fees.
After the issue was identified, Chaos Labs, which helps monitor risk parameters on Aave, worked with the protocol team to correct the configuration. The protocol itself remained solvent and did not accumulate bad debt.
Aave said affected users would be compensated using recovered funds and DAO resources. The Aave DAO and Lido both signaled support for reimbursing impacted accounts.
Although the problem was quickly fixed, the event reminded traders that technical errors can still trigger liquidations in DeFi systems.
Technical analysis: Aave price stuck inside descending channel
On the chart, Aave is trading inside a descending channel, a pattern that appears when prices register lower highs and lows. The upper trendline of the channel continues to act as resistance, while the lower boundary has provided support during recent dips.
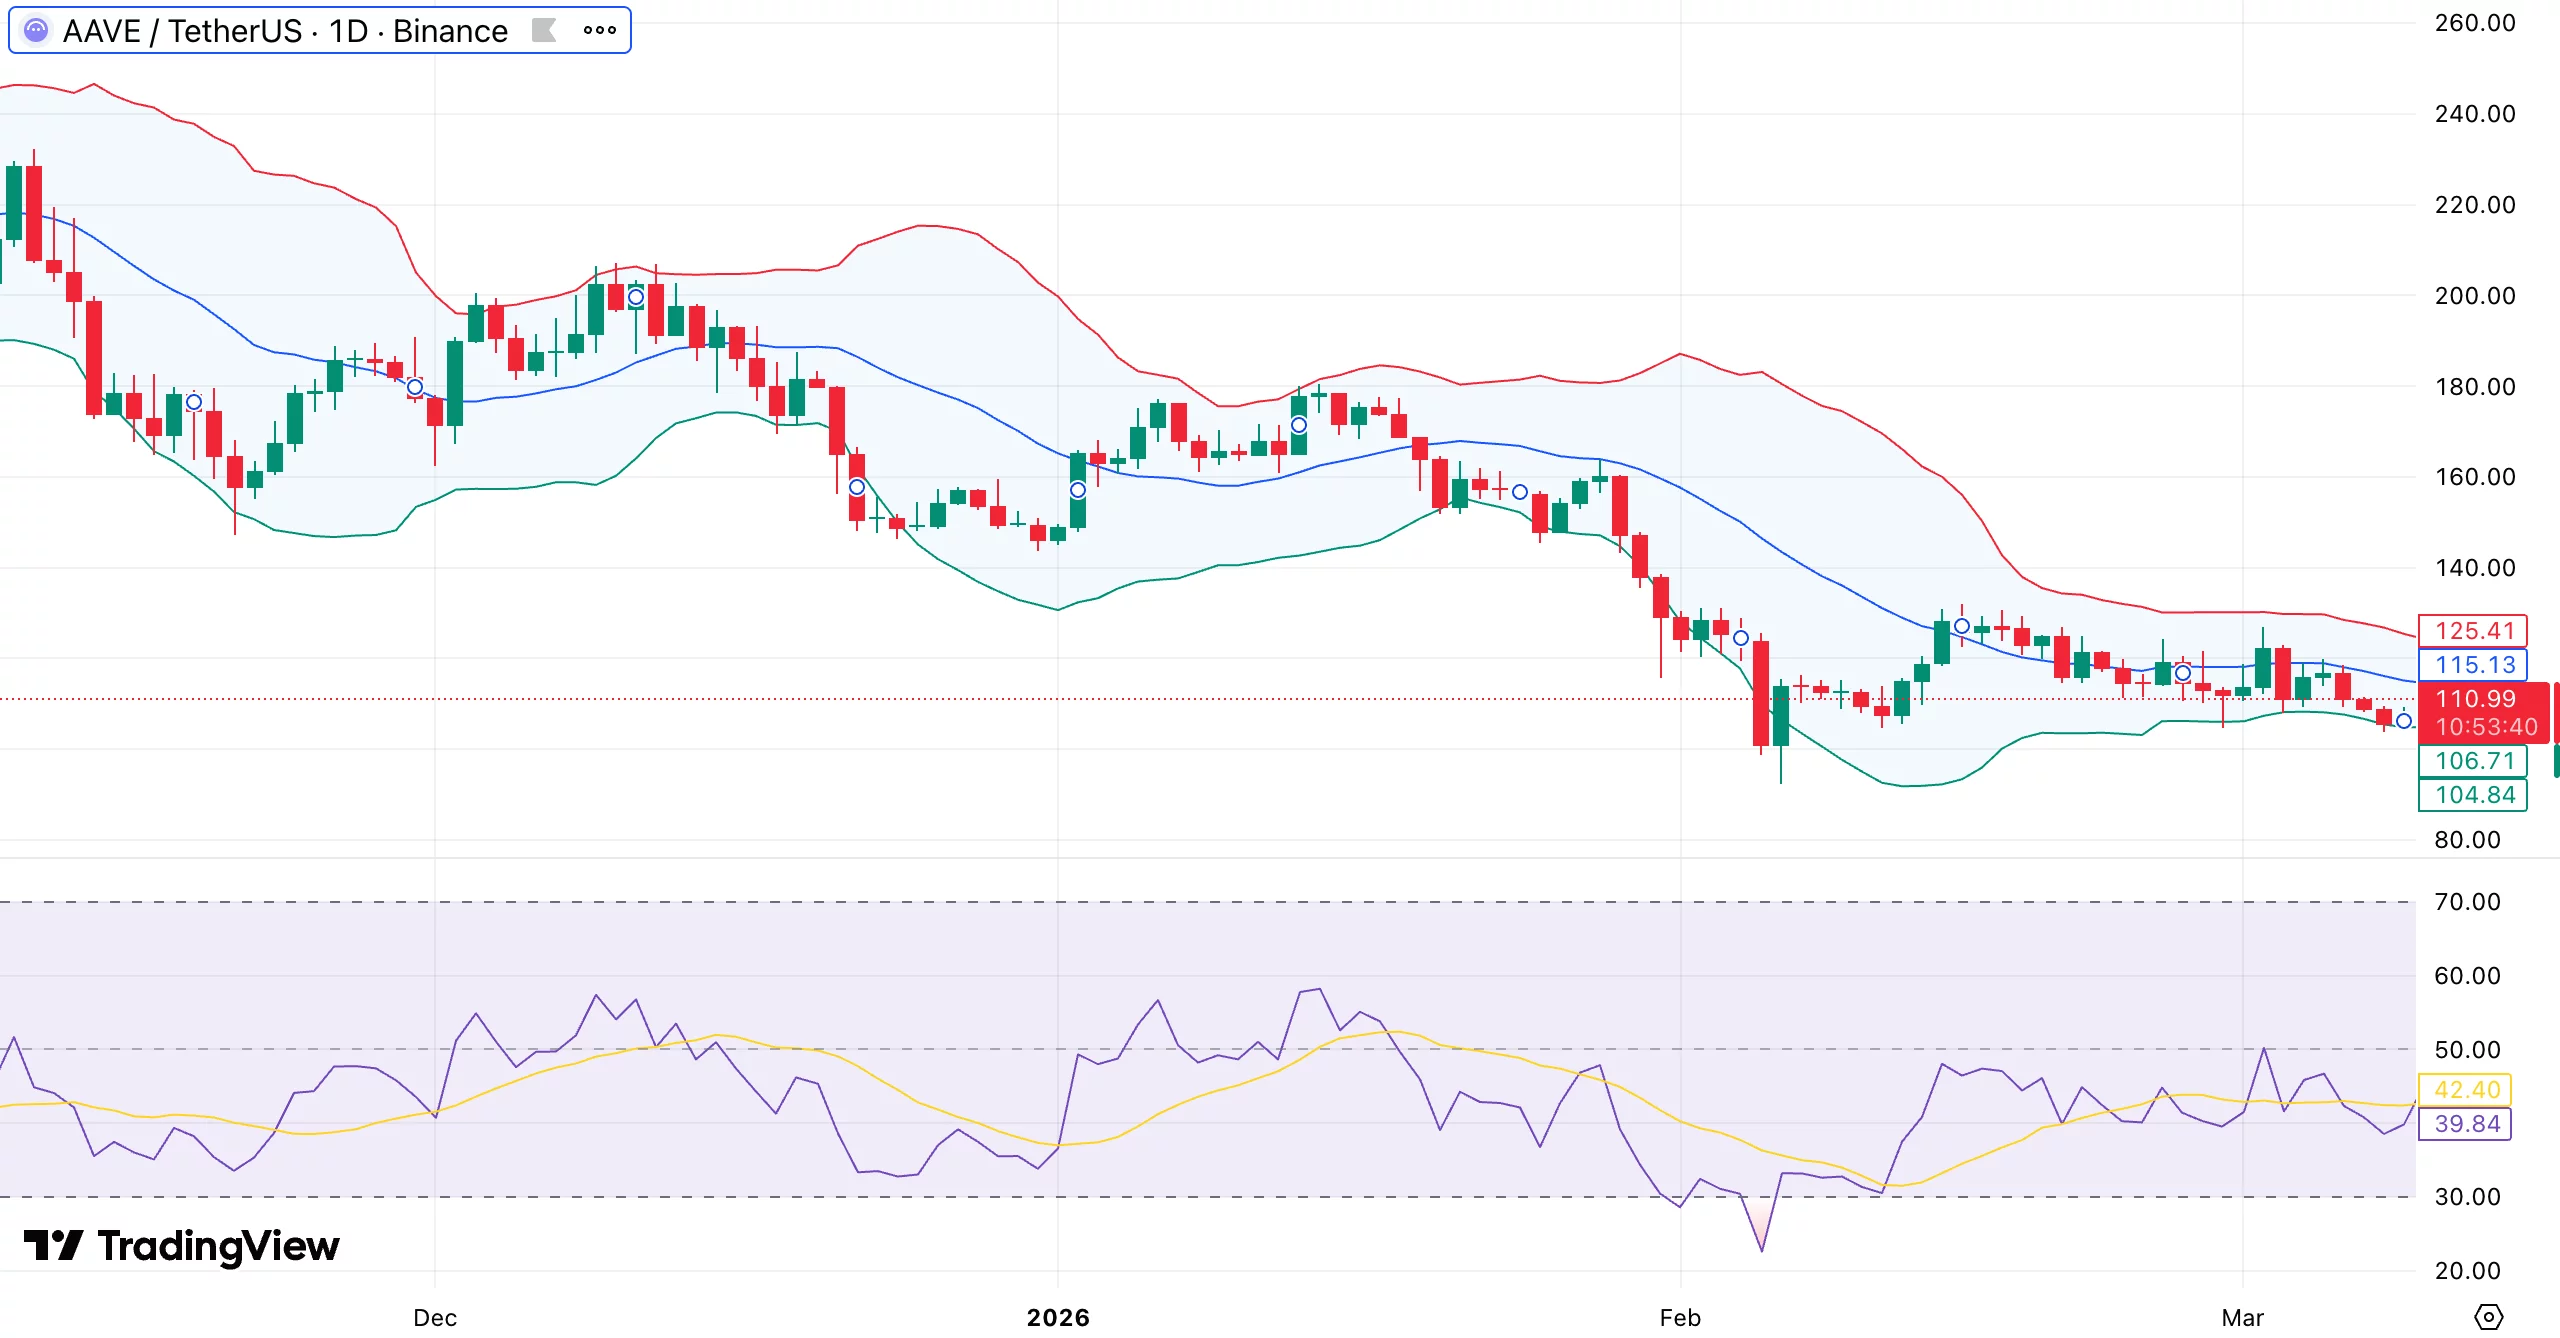
This structure often shows a bearish bias until a breakout occurs. The token is also trading below its short-term moving averages, such as the 50-day and 20-day averages, which act as overhead resistance.
Sellers will probably maintain control of the trend until the price rises above these levels. Volatility has been relatively muted. Bollinger Bands are slightly narrowing, which can happen when the market pauses before the next larger move.
Momentum indicators also lean negative. Buying strength is still restricted, as indicated by the relative strength index, which is below the 50 mark. However, the indicator is not yet in oversold territory, allowing for additional declines.
Within the channel, $110 to $115 is currently serving as a short-term support zone. If the price breaks below that range, it may move into the next demand zone.
On the upside, resistance sits around $125 to $130, where the upper channel trendline and short-term moving averages meet. A clear move above that range would be needed to shift momentum back in favor of buyers.