

 By
By How to Read Token Vesting Schedule: Unlock Sell Pressure
What You Will Accomplish

At the end of this article, you will know how to read a token allocation table from a project whitepaper or documentation site, identify when large tranches of tokens will hit circulation, and calculate whether your lending or liquidity provision position can absorb the resulting sell pressure. You will understand the difference between a cliff unlock and a linear vest, how to estimate cost basis for seed and private round investors, and which allocation categories create the most predictable downward price movement. This is not about price speculation. It is about yield risk.
The prerequisite is basic familiarity with reading a crypto whitepaper and understanding what circulating supply means. If you do not know what a tokenomics section looks like, start there.
Why Vesting Schedules Matter for Income Positions
Token vesting schedules control when insiders, team members, advisors, and early investors can sell their allocations. When a 12-month cliff expires and 15% of total supply becomes transferable in a single day, the effect on liquidity depth is not theoretical. A Keyrock study of 16,000 unlock events found that approximately 90% resulted in short-term price declines. Large unlocks exceeding 5% of circulating supply correlate with median price drops of 8-15% in the surrounding 30-day window.
If you are earning 18% APY lending that token on Aave, or providing liquidity to a DEX pair that pays 40% in rewards, the unlock event is not background noise. It is the structural event that determines whether you can exit your position at the yield you modeled or whether you will spend three months waiting for liquidity to return while your capital sits idle. The European sovereign debt crisis taught this lesson clearly: the advertised yield on Greek bonds in 2010 looked attractive until the redemption mechanism broke. The yield stopped being a yield. It became a loss that had been accruing all along, disclosed at last.
Vesting schedules are readable. They are published. They tell you exactly when the sell pressure will arrive. Your task is to interpret the terms, calculate the volume, and compare that volume to the token’s actual liquidity. This is how you time exits from income positions before unlock-driven liquidity crunches make exiting expensive.
Step 1: Locate the Allocation Table and Vesting Terms

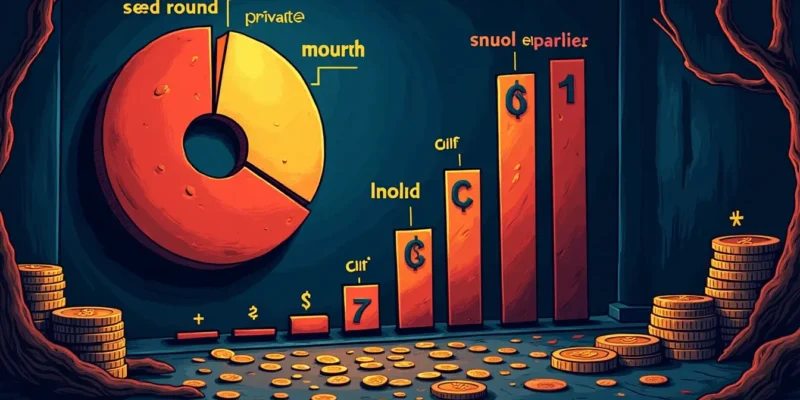
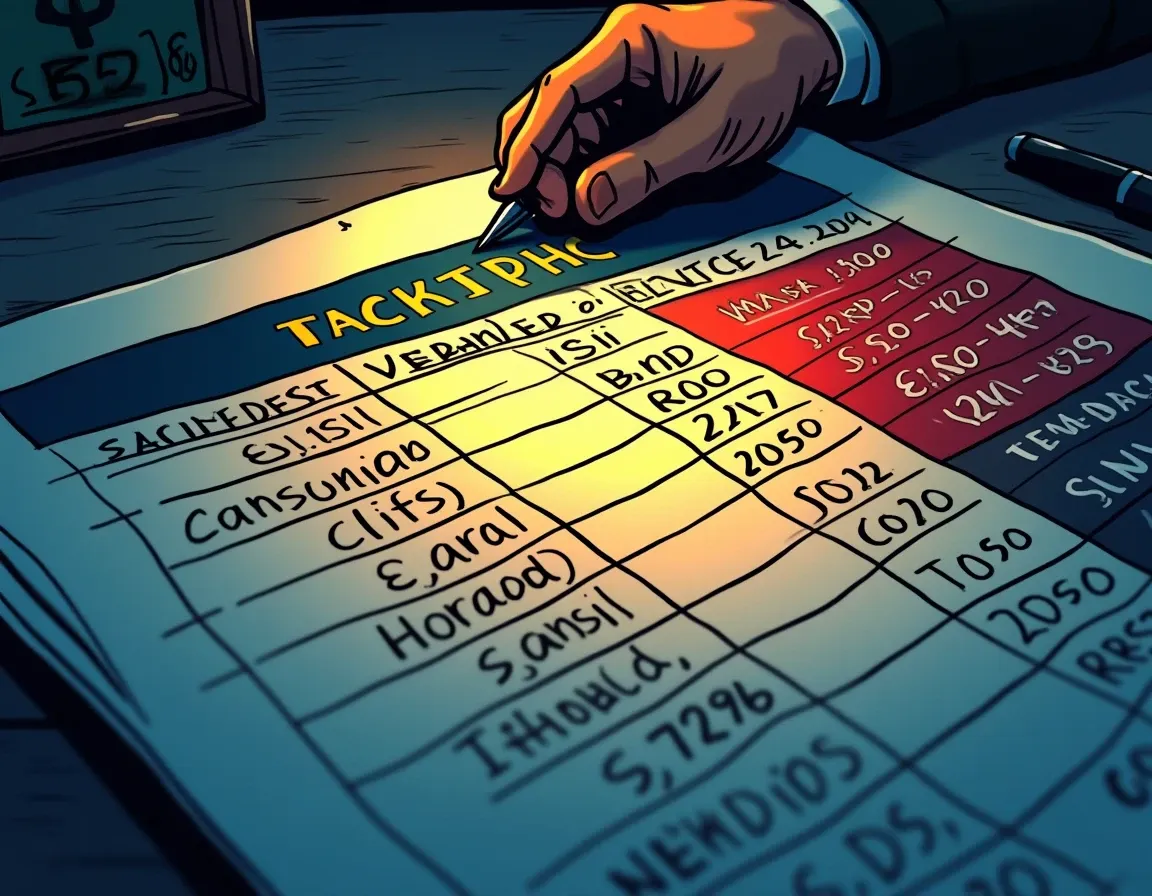
Begin with the project’s whitepaper, documentation site, or official blog. Look for a section titled Tokenomics, Token Distribution, or Allocation Schedule. What you need is a table showing how the total token supply is divided among recipient categories. The standard categories are Team, Advisors, Seed Investors, Private Round Investors, Public Sale, Ecosystem Fund, Treasury, and Community Rewards.
Each row in the table will list a percentage of total supply, a vesting period, and often a cliff. For example, Team: 20% of total supply, 12-month cliff, 36-month linear vest. That sentence contains all the information you need to calculate when 20% of the token supply can begin selling.
If the documentation does not include vesting terms, check the project’s official Medium, governance forum, or ask in the official Discord or Telegram. Projects that refuse to publish vesting schedules are signaling something worth noticing. In 2021 and 2022, multiple DeFi protocols that collapsed had unlisted or undisclosed team allocations. Transparency about vesting is not a nicety. It is a minimum standard.
Once you have the table, verify the total adds to 100%. If it does not, ask where the missing percentage went. If the project minted more tokens than documented, your entire basis for calculating dilution is wrong.
Step 2: Understand Cliff vs. Linear Vesting
Vesting schedules use two mechanisms to control when tokens become transferable: cliffs and linear unlocks. A cliff is a waiting period during which zero tokens vest. At the end of the cliff, a percentage of the allocation unlocks at once. A linear vest spreads the remaining allocation across equal installments over time, typically monthly.
The standard for team and founder allocations is a 12-month cliff. Cliff periods for investors range from 6 months for private rounds to 12-24 months for team members. The one-year cliff remains the industry standard, used by 85% of projects with team vesting schedules. After the cliff, most projects adopt a 4-year vesting schedule, meaning 25% of tokens unlock after the first year, followed by monthly or quarterly vesting of the remaining 75%.
Cliffs concentrate sell pressure into a single known date. If a project allocated 20% of total supply to the team with a 12-month cliff and a 48-month total vest, then on day 366 after the token generation event (TGE), 25% of that 20% becomes transferable. That is 5% of total supply hitting circulation in one day. This is the unlock event traders circle on calendars.
Linear vesting spreads the same total allocation across many smaller releases. Instead of unlocking 10 million tokens on one day, the contract might release roughly 27,000 tokens per day over a year. This dilutes sell pressure across time, making each individual release negligible relative to daily trading volume. The mechanism does not eliminate dilution. It distributes it, which makes it harder to observe but no less real.
When you read a vesting schedule, note which allocations have cliffs and which are linear from TGE. Public sale allocations often unlock immediately or on a short linear schedule (3-6 months). Ecosystem and community rewards may unlock over 24-48 months with no cliff. Team and private investor allocations almost always include a cliff. The logic is alignment: the cliff forces insiders to remain economically exposed for a minimum period. The reality is that the day after the cliff expires, the alignment ends.
Step 3: Calculate Unlock Volume as a Percentage of Circulating Supply
The unlock schedule shows when tokens become transferable. What it does not show on its own is whether that supply can reach the market, who controls it, or how much real liquidity can absorb it. To assess the risk to your income position, you need to calculate the unlock volume as a percentage of circulating supply at the time of the unlock, not total supply.
Circulating supply and total supply provide two different denominators. An unlock that appears small against total supply may be material against the tokens already available to trade. For example, if a project has a total supply of 1 billion tokens but only 100 million are circulating at TGE, and the team’s cliff releases 50 million tokens in month 12, that is 5% of total supply but 50% of circulating supply. The second figure is the one that matters for price impact.
Most token tracking sites report circulating supply. Cross-check it against the project’s official documentation, because some projects define circulating supply generously, including tokens that are technically unlocked but held in wallets controlled by insiders. Tokenomist provides source-verified token unlock data with precision labeling. Track cliff and linear vesting, upcoming releases, and circulating supply impact across 500+ tokens. When the definitions diverge, use the narrower one.
The formula to calculate the percentage impact of a specific unlock is straightforward. Take the number of tokens unlocking, divide by circulating supply at the time of unlock, then multiply by 100. If the result exceeds 5%, historical data suggests a high probability of measurable sell pressure within 30 days. A single unlock releasing 5% or more of circulating supply often creates 5-15% sell pressure within 48 hours.
Step 4: Estimate Recipient Cost Basis
Not all unlocks create equal sell pressure. The incentive to sell depends on the recipient’s cost basis. A team member who received tokens at zero cost, or a seed investor who paid $0.005 per token when the token now trades at $0.50, faces a 100x gain on unlock. The economic incentive to liquidate is overwhelming, regardless of the project’s long-term vision or the recipient’s public statements about holding.
Seed and private round investors typically buy at rock-bottom prices, often between $0.001 and $0.01 per token. Public sale participants pay higher prices, closer to the initial listing price. If the token appreciated between private rounds and public sale, the cost basis gap widens. When the private round unlocks, those investors are sitting on returns that public buyers cannot match. The rational action is to take profits.
Compare the typical private sale price, if disclosed, to the current trading price. If the token trades at 50x the private round price, assume maximum selling incentive on unlock. If the token trades near or below the private sale price, selling pressure may be lower, because recipients may hold for recovery. This is not sentiment analysis. It is basic economics. People sell when they have gains to realize.
Cost basis also explains why IDOs and private rounds create different risk profiles. IDO participants pay near-market prices and often face minimal or zero vesting. Private round investors pay discounts of 70-90% and accept longer vesting in exchange. When their cliff expires, the discount becomes realized profit, and the vesting period ends. The result is predictable.
Step 5: Compare Unlock Volume to Trading Volume and Liquidity Depth
The monthly unlock rate, meaning total tokens unlocking per month, is the operational metric that matters for assessing sell pressure. Compare this figure to the average daily trading volume (ADV) of the token. If the monthly unlock is equivalent to 30 days of ADV, sellers have a natural window to liquidate without catastrophic slippage. If the monthly unlock is equivalent to 120 days of ADV, the market cannot absorb it without a price correction.
You can find 30-day average trading volume on CoinGecko, CoinMarketCap, or directly on the DEX or CEX where the token trades. Check volume in dollar terms, not token terms, because dollar volume measures actual liquidity. A token with $50,000 in daily volume cannot absorb a $6 million unlock in 30 days without significant price impact.
Liquidity depth is the second variable. Open the order book on the primary exchange where the token trades. Look at the bid side. Sum the total dollar value of buy orders within 10% of the current price. If that total is smaller than the dollar value of the unlock, the unlock will move price. This is not speculation. It is arithmetic.
A 20% team allocation with a 12-month cliff and 36-month linear vest is institutional standard. Pair it with an initial liquidity pool of 2% of circulating supply and no market maker, and the team’s first unlock event in month 13 occurs against a liquidity pool that cannot absorb the sell pressure. The allocation was fine. The liquidity was not. The distribution model failed. If you are deploying yield capital into low cap tokens, this is the failure mode that matters.
Step 6: Identify High-Risk Allocation Categories
Not all allocation categories create the same sell pressure. Team, advisor, and early investor allocations are high-risk categories because recipients have low or zero cost basis and limited ongoing economic alignment after the cliff expires. Ecosystem and treasury allocations are lower risk if they are controlled by a DAO or multisig with transparent governance, because selling those tokens requires a public vote. Community reward allocations depend on distribution mechanics. If rewards are emitted gradually to stakers or liquidity providers, sell pressure is distributed. If rewards unlock in large batches to airdrop recipients, sell pressure concentrates.
Founder and team allocations typically carry the longest vesting schedules, often 3-4 years, with a 12-month cliff. Early seed investors often take higher risks and may negotiate shorter vesting periods, such as 1-2 years, compared to the 3-4 years for teams. Private and public investor allocations vest faster or unlock immediately. The logic is that public investors paid market prices and should not be locked. The result is that the highest-cost-basis holders (public buyers) can sell immediately, while the lowest-cost-basis holders (team and seed investors) must wait. When their wait ends, the incentive structure reverses.
Check the documentation for accelerated vesting triggers. Some projects include clauses that unlock tokens early if the project hits certain milestones (total value locked targets, user growth, token price levels). These triggers are rarely disclosed in the summary table. They appear in the legal documents or governance proposals. If a project can unlock 30% of team tokens early by hitting a TVL milestone that was reached three months after launch, the vesting schedule you read is not the vesting schedule that will execute.
Manual calculation is useful for understanding the mechanics. For ongoing monitoring, use dedicated unlock tracking tools. TokenUnlocks.app tracks upcoming unlocks with calendar views and provides notifications for tokens you follow. CryptoRank provides historical unlock data and their measured market impact, which allows you to compare past events for similar projects. Tokenomist labels unlocks by category (team, investor, ecosystem) and calculates the percentage of circulating supply each unlock represents.
Set alerts for tokens where you hold income positions. If you are lending a token on Aave or Compound, or providing liquidity on Uniswap or Curve, you need to know when the next major unlock is scheduled. Experienced traders begin positioning 30 or more days before major unlock dates, front-running anticipated sell pressure. If you wait until the unlock day to react, you are exiting into a market that already repriced the risk.
Cross-reference the unlock data on tracking tools with the project’s official documentation. Tracking sites sometimes mislabel allocation categories or use outdated vesting schedules if the project amended terms via governance vote. The authoritative source is the project’s published documentation or on-chain vesting contracts. If the two sources conflict, assume the on-chain contract is correct.
Common Failure Modes
The first failure mode is assuming that a published vesting schedule is immutable. Projects can and do amend vesting terms via governance proposals, especially if the token price collapsed and the team argues they need liquidity to continue development. If you are not monitoring governance proposals for the tokens you hold, you will miss these changes until the unlock happens.
The second failure mode is confusing unlock with sell pressure. A token unlock does not automatically trigger a price drop. Price impact depends on token utility, market sentiment, liquidity conditions, on-chain allocation behavior, and broader BTC and ETH trends. Unlock volume alone does not determine price movement. Token usage and investor behavior matter more. If recipients choose to stake unlocked tokens or hold for long-term appreciation, sell pressure may not materialize. But planning your exit on the assumption that insiders will act against their financial interest is not risk management. It is hope.
The third failure mode is ignoring the difference between vesting schedules for different investor cohorts. A project may advertise a 48-month team vest and neglect to mention that seed investors have an 18-month total vest with a 6-month cliff. The seed round often represents 10-15% of total supply and was sold at the lowest price. When that cohort unlocks in month 7, the impact is larger than the team unlock in month 13, even though the team allocation is bigger, because the seed investors have the highest cost basis multiplier and the earliest exit window.
The fourth failure mode is treating unlock schedules in isolation from liquidity depth. Projects launching with low float (5-15% of total supply circulating at TGE) and long vesting schedules create the appearance of scarcity. The token can appreciate rapidly in the first 6-12 months because circulating supply is constrained. Then the first major unlock hits, and circulating supply doubles in a month. The price corrects not because the project failed but because the supply-demand balance shifted. If you are holding a yield position through that correction, your notional APY is irrelevant. Your actual return depends on the exit price.
What to Do Next
Pull up the tokenomics documentation for the three highest-yielding positions you currently hold. Find the allocation table. Identify the vesting schedule for team, advisors, and early investors. Calculate when the next major cliff expires and what percentage of circulating supply will unlock. Compare that unlock volume to 30-day average trading volume. If the unlock exceeds 10% of circulating supply or represents more than 60 days of average volume, set a calendar reminder for 30 days before the unlock date.
Review your position size in that token. If you are providing liquidity, calculate your impermanent loss exposure if the token declines 10-15% in a two-week window. If you are lending, check the utilization rate and your ability to withdraw on short notice. The question you are answering is whether you can exit the position before the unlock or whether you are structurally locked in. If you cannot exit, the yield you are earning is compensating you for a dilution event you have already committed to absorbing.
For future positions, make reading the vesting schedule part of your initial due diligence. A token offering 60% APY on stablecoin pairs with a 12-month team cliff expiring in 45 days is not offering 60% APY. It is offering whatever yield you can realize in 45 days, minus the expected price impact of the unlock, minus your exit slippage. That is the actual return. The advertised APY is the return you would earn if supply never increased and liquidity never contracted. Those conditions do not hold.
The Takeaway
Token vesting schedules are published because they are contractually binding. They tell you exactly when large allocations of low-cost-basis tokens will become transferable, who holds them, and what percentage of circulating supply they represent. Reading a vesting schedule is not about predicting price. It is about predicting liquidity depth and sell pressure at known future dates. When you are earning yield by lending or providing liquidity, those dates determine whether you can exit your position at the modeled return or whether you will spend weeks waiting for liquidity to recover while the opportunity cost accrues.
The eurozone sovereign debt crisis demonstrated what happens when investors ignore the difference between advertised yield and sustainable yield. Greek bonds paid high coupons until the redemption mechanism broke. The yield was not compensation for risk. It was the market pricing in the probability of default. Crypto unlock events are not defaults, but they are predictable supply shocks, and the market prices them in advance if participants are paying attention. Your task is to be the participant who reads the schedule, calculates the volume, and exits before the liquidity crunch begins.
A 12-month cliff is not a mystery. It is a countdown. Treat it as one.
Frequently Asked Questions
What is the difference between a cliff and linear vesting?
A cliff is a waiting period during which zero tokens vest. At the end of the cliff, a percentage unlocks at once. Linear vesting spreads the remaining allocation across equal installments over time, typically monthly. The standard is a 12-month cliff followed by 36 months of linear vesting. Cliffs concentrate sell pressure into a single date. Linear vesting distributes it, making each release smaller but the total dilution identical.
How do I calculate unlock volume as a percentage of circulating supply?
Take the number of tokens unlocking, divide by circulating supply at the time of unlock, then multiply by 100. Use circulating supply, not total supply. For example, if 50 million tokens unlock and circulating supply is 100 million, the unlock represents 50% of circulating supply. Historical data shows unlocks exceeding 5% of circulating supply often create 5-15% sell pressure within 48 hours.
Which allocation categories create the most sell pressure?
Team, advisor, and early seed investor allocations create the most sell pressure because recipients have the lowest cost basis, often $0.001 to $0.01 per token, and limited ongoing economic alignment after the cliff expires. Seed investors who bought at 100x below current price face maximum incentive to liquidate on unlock. Public sale and community reward allocations carry higher cost basis and distribute more gradually, reducing concentrated sell pressure.
Where can I find upcoming token unlock dates?
TokenUnlocks.app tracks upcoming unlocks with calendar views. CryptoRank provides historical unlock data and measured market impact. Tokenomist offers source-verified unlock schedules with precision labeling for 500+ tokens. Always cross-reference tracking sites with the project’s official documentation or on-chain vesting contracts, because projects sometimes amend vesting terms via governance votes that tracking sites do not immediately reflect.
Do all token unlocks cause price drops?
No. Approximately 90% of large unlock events result in short-term price declines, according to a Keyrock study of 16,000 events. Price impact depends on unlock size relative to circulating supply, trading volume, liquidity depth, recipient cost basis, and broader market conditions. If recipients stake unlocked tokens or if the unlock is small relative to daily volume, sell pressure may not materialize. However, planning exits on the assumption insiders will not sell is hope, not risk management.
The Weekly Yield Report
You now know how to calculate unlock volume against circulating supply and compare it to trading liquidity. Those unlock dates and liquidity ratios will change every week.
Every Thursday: where crypto yield actually is – stablecoins, liquid staking and DeFi lending, with the risk named next to the rate and what changed since last week.
Free. No trade calls, no allocations, no hype. Unsubscribe in one
click.