



 By
By Can Hedera price break $0.12 in October as weekly signals turn bullish?
Hedera price has retreated about 23% from its late-September peak near $0.131, leaving HBAR close to $0.101 as traders assess whether support at $0.10 can hold through October.
Summary
- Hedera price was trading near $0.101 after surrendering much of its late-September surge toward $0.131.
- The daily Ichimoku conversion line stands at $0.11166, above the token’s latest price.
- Weekly Supertrend support sits at $0.06943, while the Awesome Oscillator has turned positive.
- CoinGlass shows overhead liquidation concentrations around $0.107–$0.114 and further bands below $0.10.
TradingView’s Binance HBAR/USDT daily chart places Hedera at $0.10120, down 2.70% for the displayed session. The token traded between $0.10019 and $0.10489, keeping the latest decline close to the round-number support level.
The late-September advance briefly carried HBAR toward $0.131 before a steep reversal returned it to the low-$0.10 range. Based on those chart levels, the retreat amounts to approximately 22.7%, while a return to the peak would require a gain of about 29.4% from $0.10120.
The daily and weekly charts present different conditions. Daily price action shows weaker momentum after the spike, but the weekly chart retains a bullish Supertrend signal and a positive momentum reading. October’s recovery case therefore depends on whether nearby support survives while HBAR works through resistance above its current price.
Hedera price faces an early test at $0.1117
On TradingView’s daily chart, the Ichimoku conversion line stands at $0.11166, while the base line is $0.10146. HBAR sits just below the base line and roughly 9.4% below the conversion line, placing two separate hurdles above the latest price.
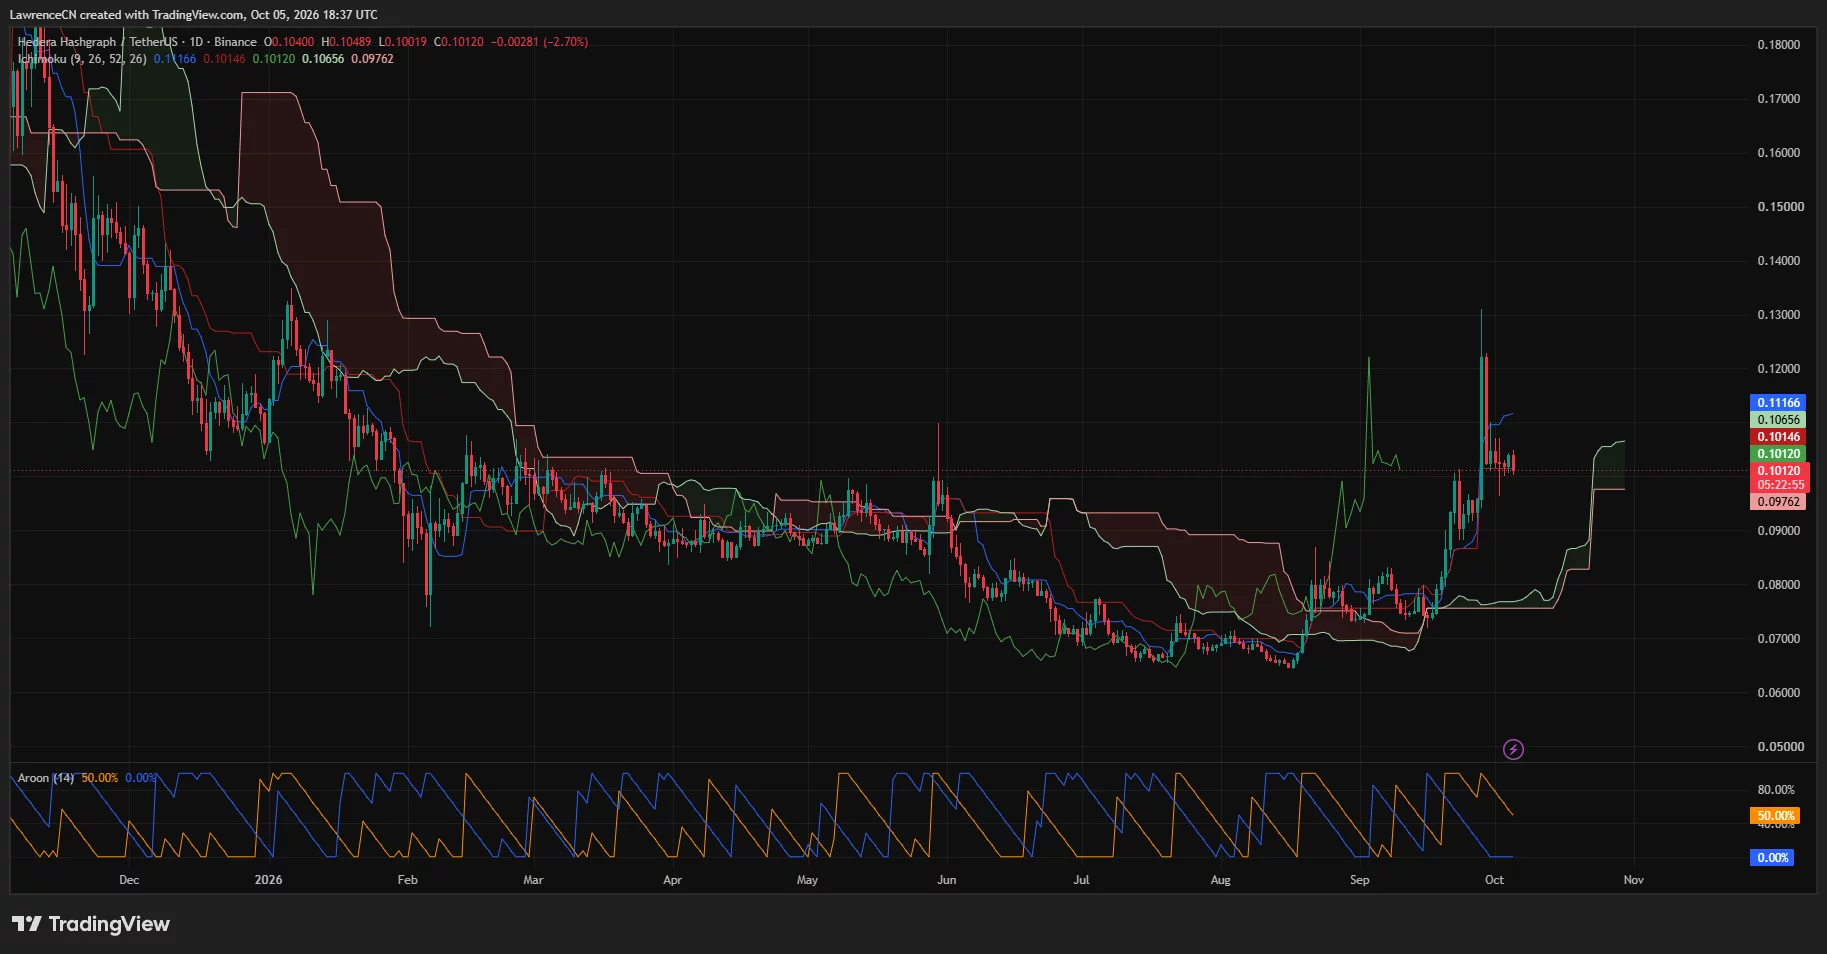
A recovery through $0.10146 would bring price back above the baseline. Holding that level through a subsequent pullback would support an attempt to reach the conversion line, although the larger gap to $0.11166 shows how much ground buyers still need to recover.
The forward Ichimoku cloud spans approximately $0.09762–$0.10656. Its lower edge lies below the current price, while its upper edge sits around 5.3% higher, creating another nearby reference point for an October rebound.
The forward cloud turns green, but HBAR remains below the daily conversion line. In the chart-based bullish scenario, price would first recover the base line, then move through $0.10656 before testing $0.11166. Rejection at either higher level would leave the recovery incomplete.
Daily Aroon readings show Aroon Up at 50% and Aroon Down at 0%. The upward reading has eased from its stronger late-September position, consistent with the growing distance from the recent high, while the downward reading remains low because the longer lookback has not registered a fresh low.
Together, the daily indicators leave HBAR with a mixed setup. Price has lost the sharp upward pace of the September rally, but the Aroon readings do not show a new low dominating the same observation window. Holding $0.10 would preserve the immediate consolidation; reclaiming $0.11166 would provide a stronger recovery signal.
Weekly momentum improves below $0.1405 resistance
TradingView’s weekly chart places HBAR at $0.10126, with the Supertrend support line at $0.06943. The indicator has switched to green following the recent recovery, leaving its support approximately 31.4% below the latest weekly price.
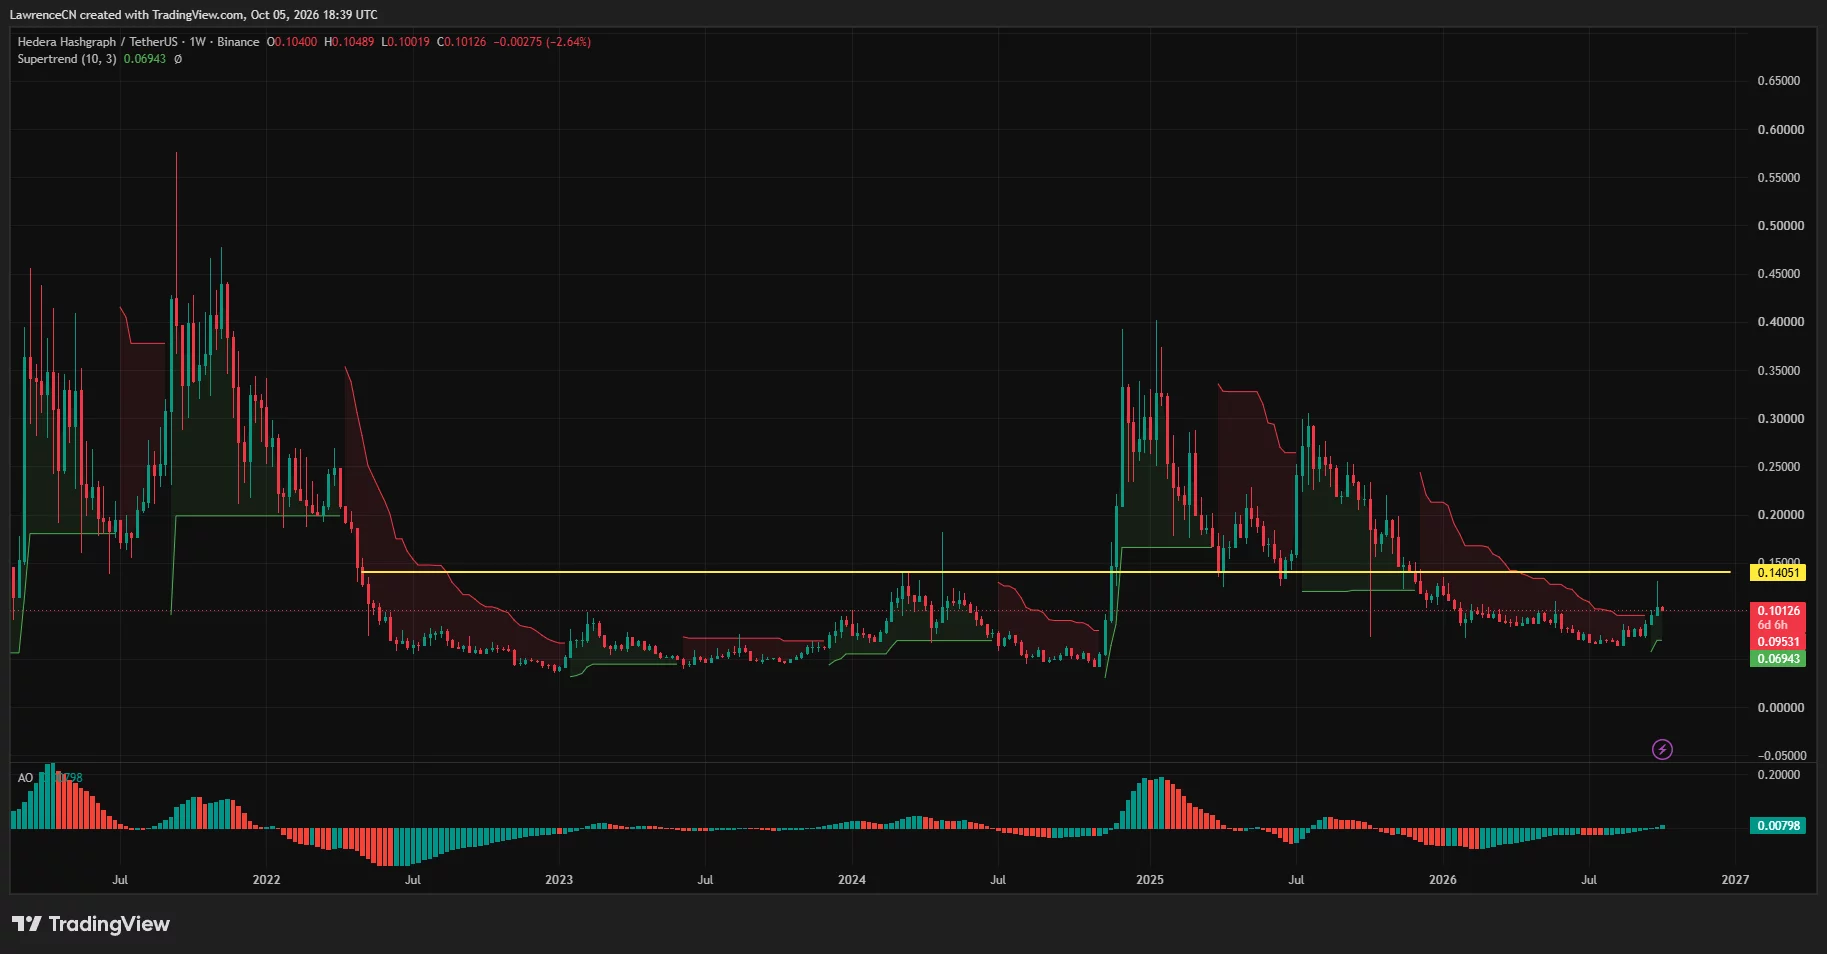
The weekly Awesome Oscillator reads 0.00798, with green bars above zero. Its move into positive territory follows an extended period of negative readings, giving the weekly recovery a firmer momentum signal than the latest daily pullback alone would suggest.
However, the chart’s marked horizontal resistance at $0.14051 remains well above the current market. HBAR would need to rise approximately 38.8% from $0.10126 to reach that level, making it a larger recovery objective after the nearer resistance areas have been cleared.
The weekly price history shows several past reactions around the $0.14 region. A return there would bring HBAR back to a price area that acted as a turning point during earlier market cycles, rather than simply extending the latest rebound into an untested zone.
The late-September high near $0.131 comes before that weekly barrier. For the October bullish scenario, a move above $0.11166 would open a test of $0.12, followed by the recent peak. Breaking and holding above $0.131 would then put the marked $0.14051 resistance in focus.
The weekly Supertrend offers a more distant downside reference, but $0.10 remains the nearer test. A token can retain a bullish weekly indicator while suffering a substantial daily correction, particularly when the indicator’s support line sits far below the market.
Giannis Andreou’s recovery case needs $0.085–$0.10 support
In an Oct. 5 post on X, analyst Giannis Andreou identified $0.12–$0.15 as Hedera’s next weekly resistance zone. His bullish scenario requires the $0.085–$0.10 region to hold through a retest, followed by a sustained recovery above resistance.
“My bullish scenario needs $0.085–$0.10 to hold through a retest, followed by a sustained reclaim of that resistance.”
Andreou’s support range includes the current $0.10 test but extends below it. Under his framework, a brief loss of $0.10 would not automatically invalidate the broader recovery, provided HBAR found support inside the wider band and subsequently recovered.
The analyst listed $0.20 and $0.40 as later levels, with the historical high near $0.576 and $0.60 beyond it. He framed those prices as a full-cycle recovery scenario, with a weekly close below $0.055 invalidating his setup.
For October, his nearer $0.12–$0.15 resistance zone is the more immediate reference. The larger targets depend on several earlier barriers being cleared and were not presented as a forecast for the month.
Liquidation bands frame the next move around $0.10
CoinGlass’s one-month HBAR liquidation heatmap shows several overhead concentrations around $0.107–$0.114. Further bands appear around $0.12–$0.125 and near $0.132, broadly overlapping the price regions HBAR would encounter during a recovery toward its September peak.
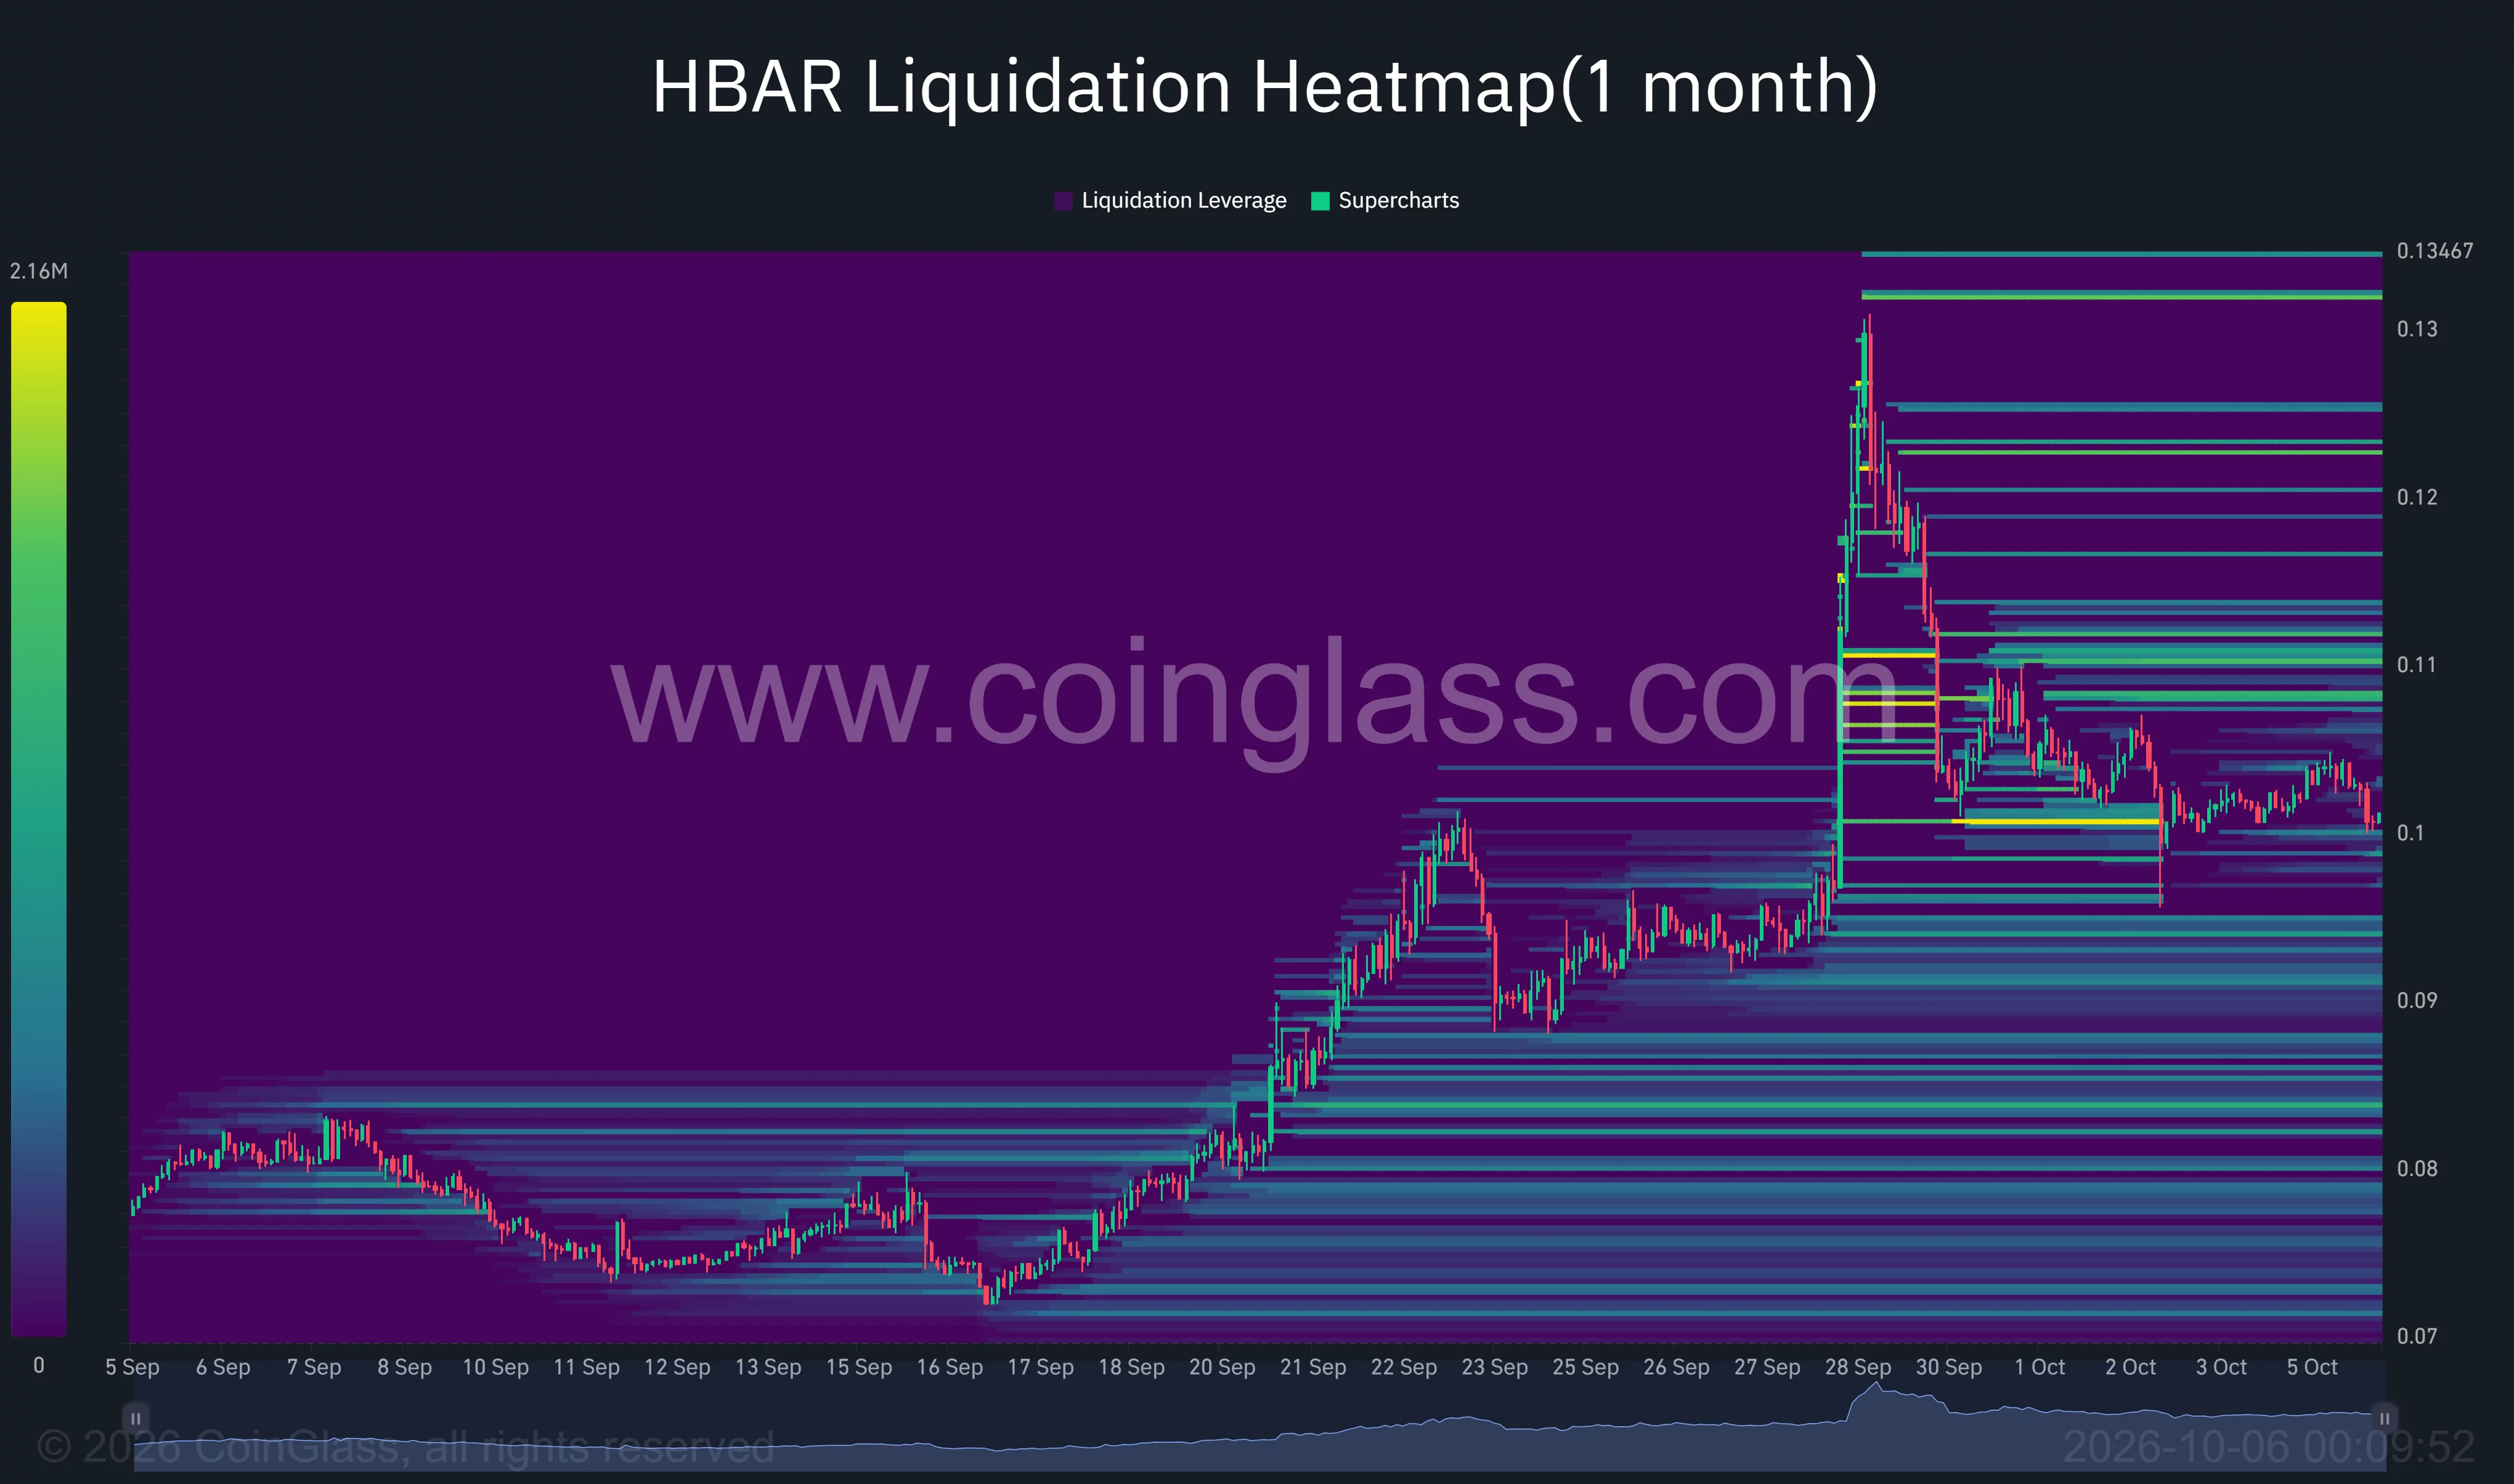
Below the market, the heatmap shows concentrations around $0.098, $0.094–$0.095 and $0.091–$0.092. Additional bands lie in the high-$0.08 range, providing lower reference areas if the current support test gives way.
The immediate chart-based bearish scenario begins with a sustained loss of $0.10, followed by failure to recover it. A move below the forward cloud’s $0.09762 lower boundary would then bring the $0.094–$0.095 region into focus, where September price consolidation and liquidation concentrations overlap.
Failure to hold that area would expose the next visible region around $0.09. Andreou’s $0.085 lower support boundary would become relevant during a deeper correction, before the more distant weekly Supertrend level at $0.06943.
IBM development provides context as October resistance builds
The Hashgraph Group announced on Sep. 23 that its Hedera-based IDTrust identity platform had been validated and listed in the IBM Cloud Catalog. The company described the product as a digital identity platform supporting verifiable identities for AI agents.
Separately, IBM said on Sep. 28 that IBM Agent Identity and HashiCorp Vault integrate with NVIDIA OpenShell. IBM’s announcement identified those products as part of its work around NVIDIA’s Open Agent Safety Platform.
For US investors, Nasdaq’s listing notice confirmed that the Canary HBAR ETF began trading under HBR on Oct. 28, 2025. The listing provides a US exchange-traded route for HBAR exposure alongside direct token ownership.
The October technical outlook remains centered on $0.10 support and the daily conversion line at $0.11166. Holding support and clearing that line would strengthen the case for $0.12–$0.131, while a sustained break below $0.09762 would shift attention toward $0.095 and $0.09.
Disclosure: This article does not represent investment advice. The content and materials featured on this page are for educational purposes only.