


Bitcoin price stalls at $65K as holder selling risk rises
Bitcoin price held near $65,000 on Aug. 8, but its failure to reclaim the short-term holder cost basis left the recovery exposed to renewed selling.
Summary
- Bitcoin price traded near $65,015, about 3.7% below the short-term holder realized price.
- The $67,523 cost basis could attract selling from holders seeking to exit near breakeven.
- 4-hour momentum remains positive, with the RSI at 61.8 and price above the Bollinger midline.
- Liquidation clusters near $65,600 and $63,000–$63,800 could determine the next move.
Bitcoin price struggles to hold above $65,000
According to data from crypto.news, Bitcoin (BTC) price was trading near $65,015 at the time of writing after repeatedly testing the $65,000 area. The daily candle had traded between $64,784 and $65,075, showing limited volatility following the rebound from its late-July lows.
The price has recovered from an Aug. 2 low near $62,200, but sellers continue to defend the area immediately above $65,000. In an Aug. 8 X post, analyst Ted Pillows said Bitcoin had failed to establish a firm hold above that threshold.
“BTC failed to hold above the $65,000 level. Sellers are still active in this zone, and Bitcoin needs to reclaim it for stronger upside.”
The daily chart shows BTC trading above its 20-day and 50-day simple moving averages at $64,461 and $63,363, respectively. Those averages form an initial support zone between approximately $63,300 and $64,500.
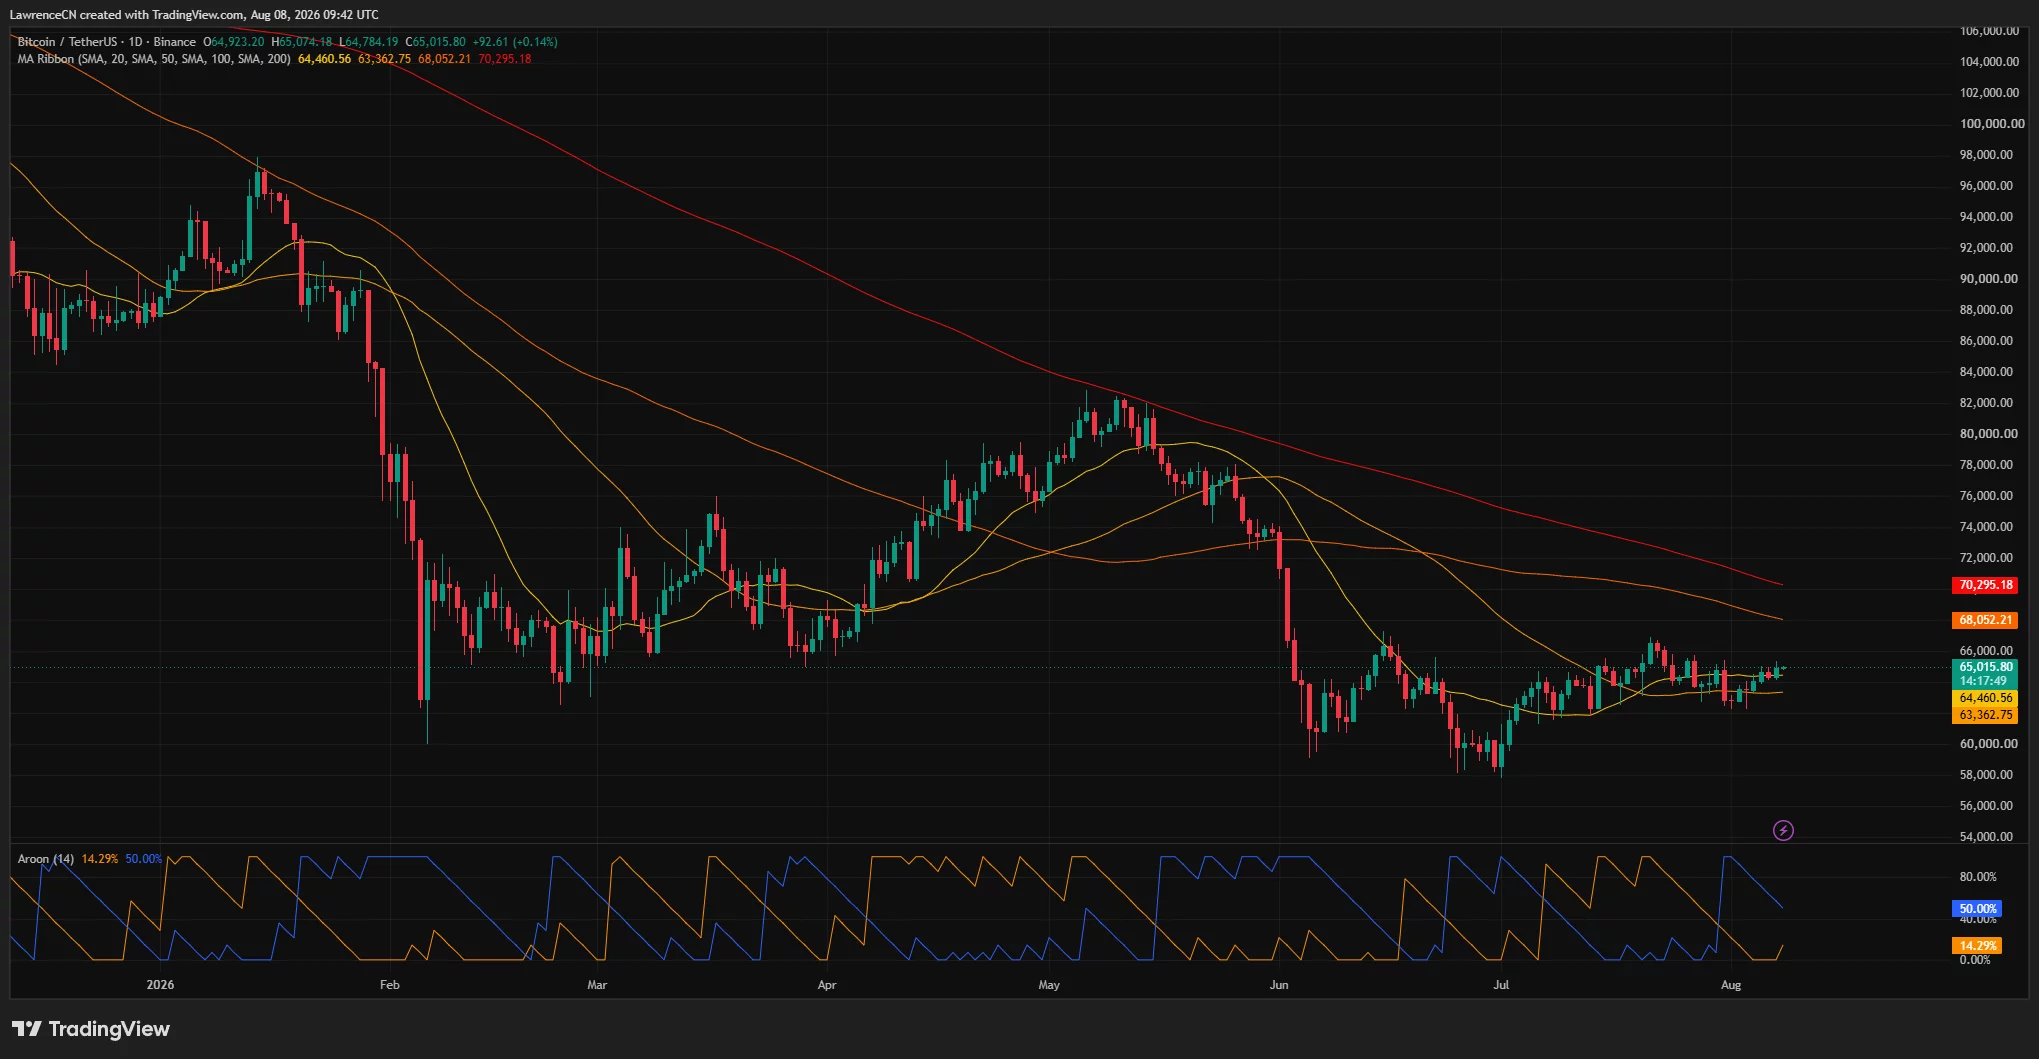
Bitcoin remains below its 100-day SMA at $68,052 and its 200-day SMA at $70,295. That structure shows that the short-term recovery has not yet reversed the broader downtrend that began after BTC reached approximately $82,000 in May.
Short-term holders could sell near $67,523
CryptoQuant analyst Axel Adler Jr. said Bitcoin remained below the realized price of short-term holders, which measures the average acquisition price of coins held for less than 155 days.
As of Aug. 8, Adler placed the short-term holder realized price at $67,523, compared with a BTC spot price of $64,952. That left Bitcoin $2,571, or 3.8%, below the cost basis.
The gap was the narrowest since July 21, bringing more short-term holders closer to breakeven. Investors who bought above the current price may use a recovery toward $67,500 to reduce exposure without taking a large loss.
Adler said Bitcoin had closed below the short-term holder realized price during 279 of the previous 284 days. He expects selling pressure to increase as the market approaches the cost line.
“STHs will start dumping into the market to close their positions at breakeven.”
The forecast is not guaranteed, but the cost basis creates a visible resistance area. Bitcoin would need to absorb potential holder selling and establish support above $67,523 to improve the medium-term structure.
BTC technical indicators favor a $65,250 test
The 4-hour chart offers a more constructive short-term picture. Bitcoin is trading above the Bollinger Band midline at $64,647 and close to the upper band at $65,257.
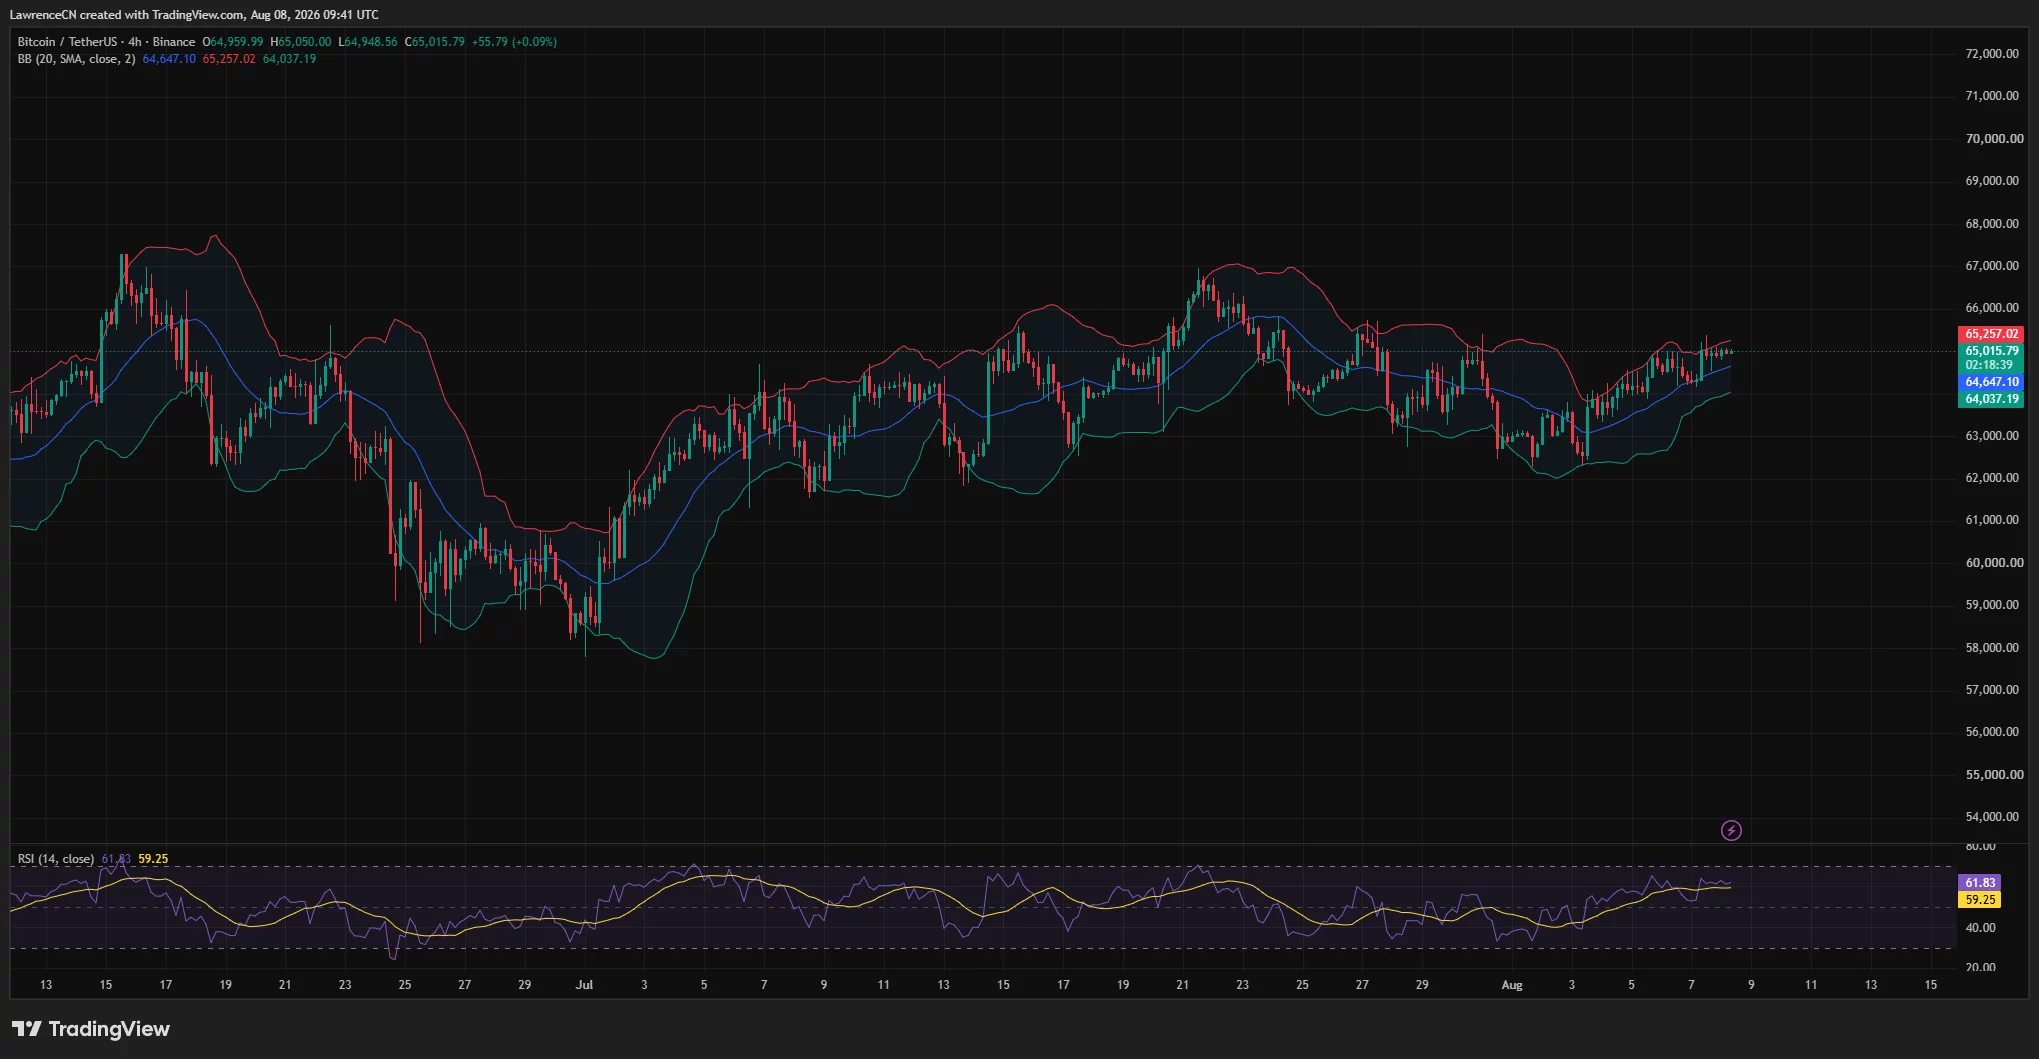
A 4-hour close above the upper band could support a move toward $65,600, followed by $66,000. The next major resistance would sit around the short-term holder cost basis between $67,500 and $67,600.
The relative strength index stood at 61.83, above its moving average of 59.25. That reading shows buyers currently have the momentum advantage without pushing BTC into overbought territory.
Momentum on the daily timeframe remains less decisive. Aroon Up stood at 50%, while Aroon Down was at 14.29%. The difference favors buyers, but the moderate Aroon Up reading does not yet confirm a strong daily uptrend.
BTC must first turn $65,000 into support and clear the $65,250–$65,600 range. A rejection could send the price back toward the Bollinger midline at $64,647, followed by the lower band at $64,037.
A deeper decline would expose $63,360, where the daily 50-day SMA is located. Pillows identified a broader demand zone near $62,000–$63,000, with further support around $59,000 if that area fails.
Liquidation heatmap shows pressure on both sides
CoinGlass’ one-week liquidation heatmap shows leveraged positions concentrated above and below Bitcoin’s current price.
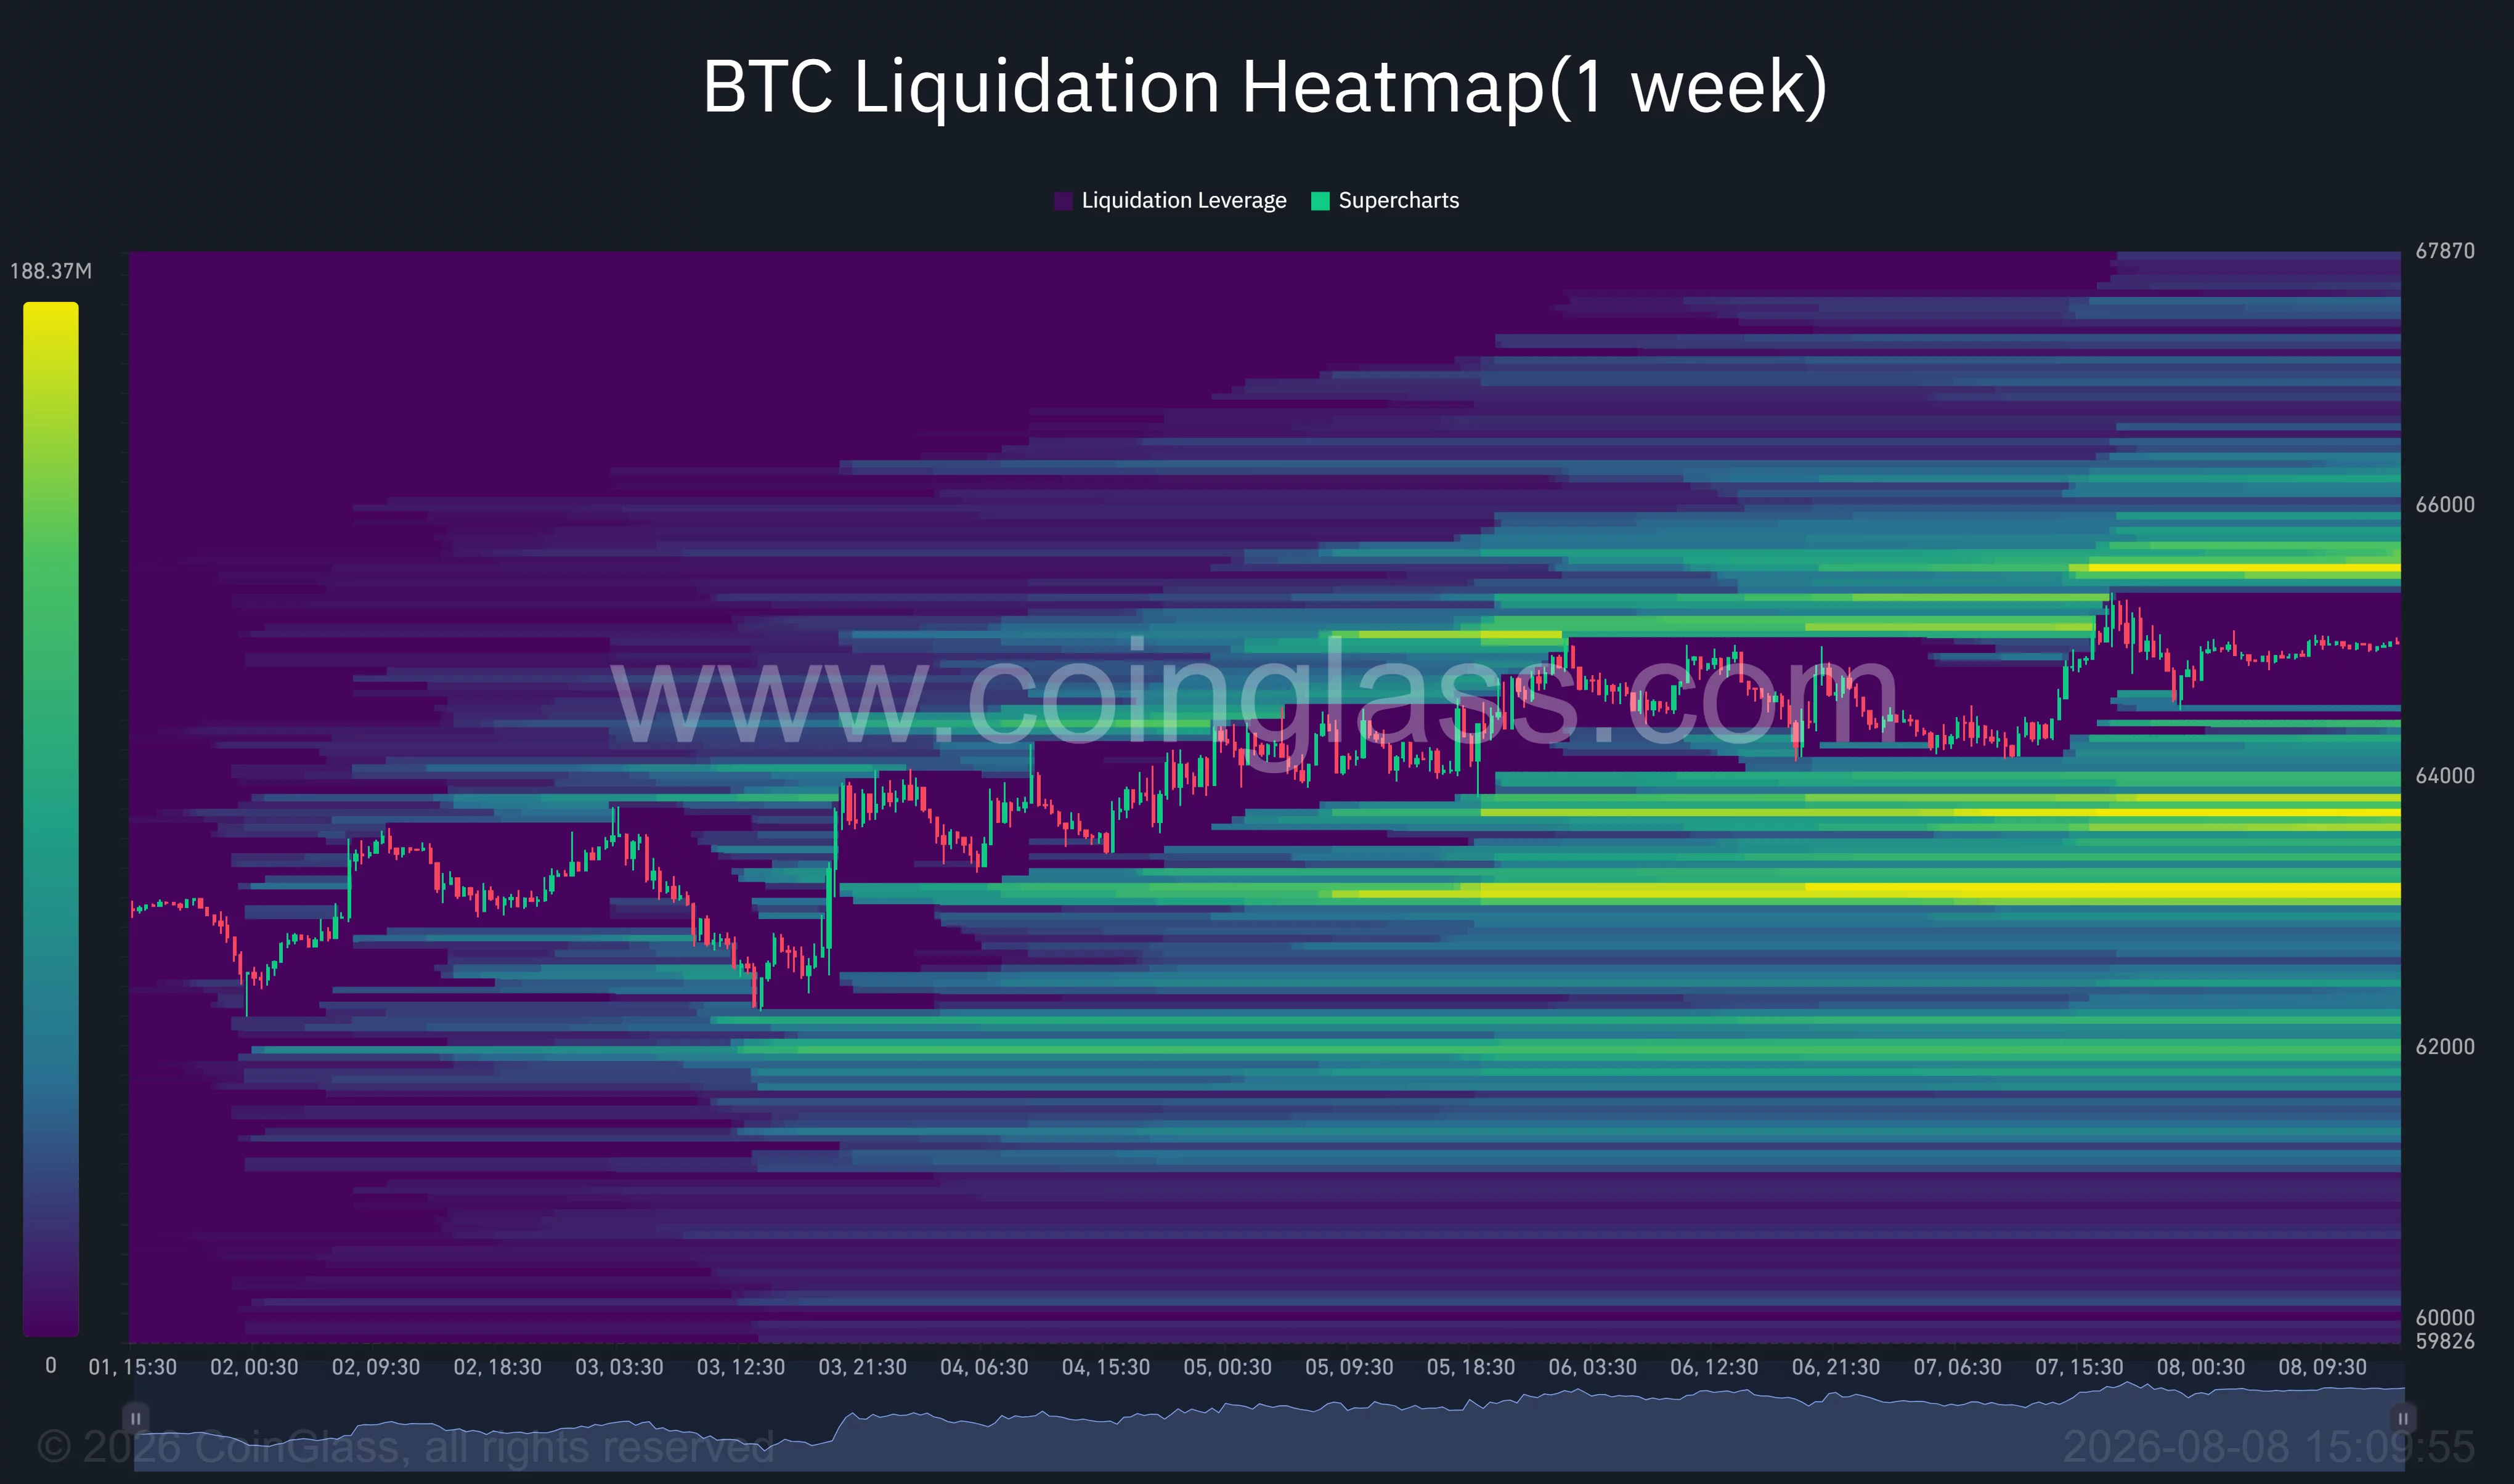
The nearest major upside cluster appears around $65,500–$65,700. A move through that zone could liquidate short positions and accelerate a test of $66,000. Additional liquidity is visible above $66,000, although the concentration is weaker.
Larger downside clusters are located around $63,700–$63,900 and close to $63,000. These areas could attract price if Bitcoin loses the 4-hour Bollinger midline and the $64,000 level.
This positioning leaves BTC between competing liquidity pools. A breakout above $65,600 would favor a short squeeze, while a loss of $64,000 could pull the market toward the denser downside clusters.
For U.S. investors, the weekend move will occur while spot Bitcoin ETFs and CME futures are closed. Any sharp breakout before Monday could therefore produce a gap between Bitcoin’s continuously traded spot market and the reopening of regulated U.S. products.
The immediate bias remains mildly bullish while BTC holds above $64,000. However, the short-term holder cost basis at $67,523 and the long-term moving averages above $68,000 remain major barriers to a broader recovery.
Disclosure: This article does not represent investment advice. The content and materials featured on this page are for educational purposes only.