

Will OKB token price crash after 200% surge?
OKB token price could be headed for a reversal following its 200% rally, as sentiment turns negative amid whale sell-offs.
Summary
- OKB surged nearly 200% to an all-time high of $125.88 before retreating to $104.4 as sentiment turned bearish.
- Santiment data shows negative weighted sentiment and increased short positions.
- Fibonacci analysis highlights $81.96 as a key support level from current levels.
According to data from crypto.news, OKB (OKB), the native token of crypto exchange OKX, rallied nearly 200% to an all-time high of $125.88 yesterday, Aug. 13, with its market cap soaring to $7.4 billion at the time.
However, the token has since shed some of its gains and was trading at $104.4 as of press time. It will likely continue to see losses amid growing bearish sentiment in the market.
Data from Santiment shows that OKB’s weighted sentiment has shifted further into negative territory following its recent gains, indicating that traders are increasingly expecting a potential pullback.
The weighted funding rate in its futures market has also turned negative, indicating that a growing number of traders are opening short positions in anticipation of a further dip in prices.
The backdrop also comes as whales appear to be offloading their OKB holdings. Santiment data shows a sharp drop in the number of whale addresses holding between 10,000 and 100 million tokens following OKB’s skyrocketing rally yesterday.
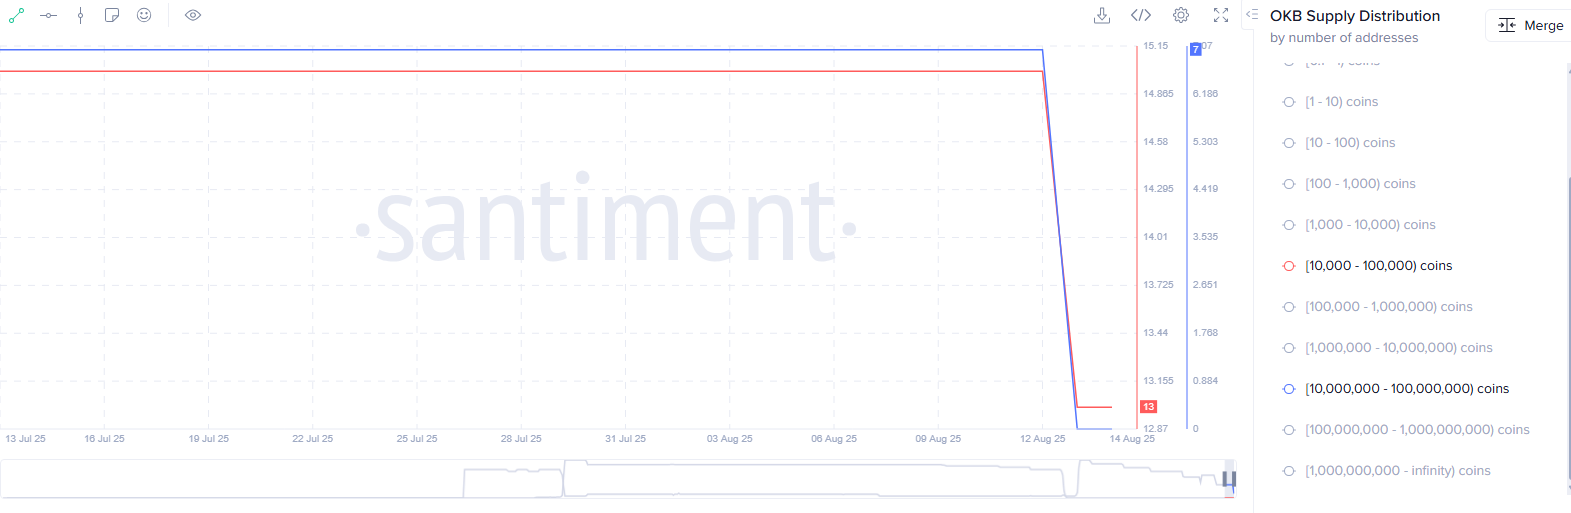
Such a sell-off from whale investors could lead to further declines if it triggers panic selling among retail traders who often follow these deep-pocketed investors into or out of positions.
It is also common in the crypto market for early investors to sell off their holdings to lock in profits after a cryptocurrency reaches an all-time high. Such moves can accelerate a price decline for OKB if they coincide with a broader market sell-off, especially since the overall crypto market remains close to its new peak and could face heightened volatility.
OKB price analysis
On the daily chart, OKB’s price has not established any distinct pattern, as its recent surge followed months of consolidation within the $34–$65 range since the beginning of the year.
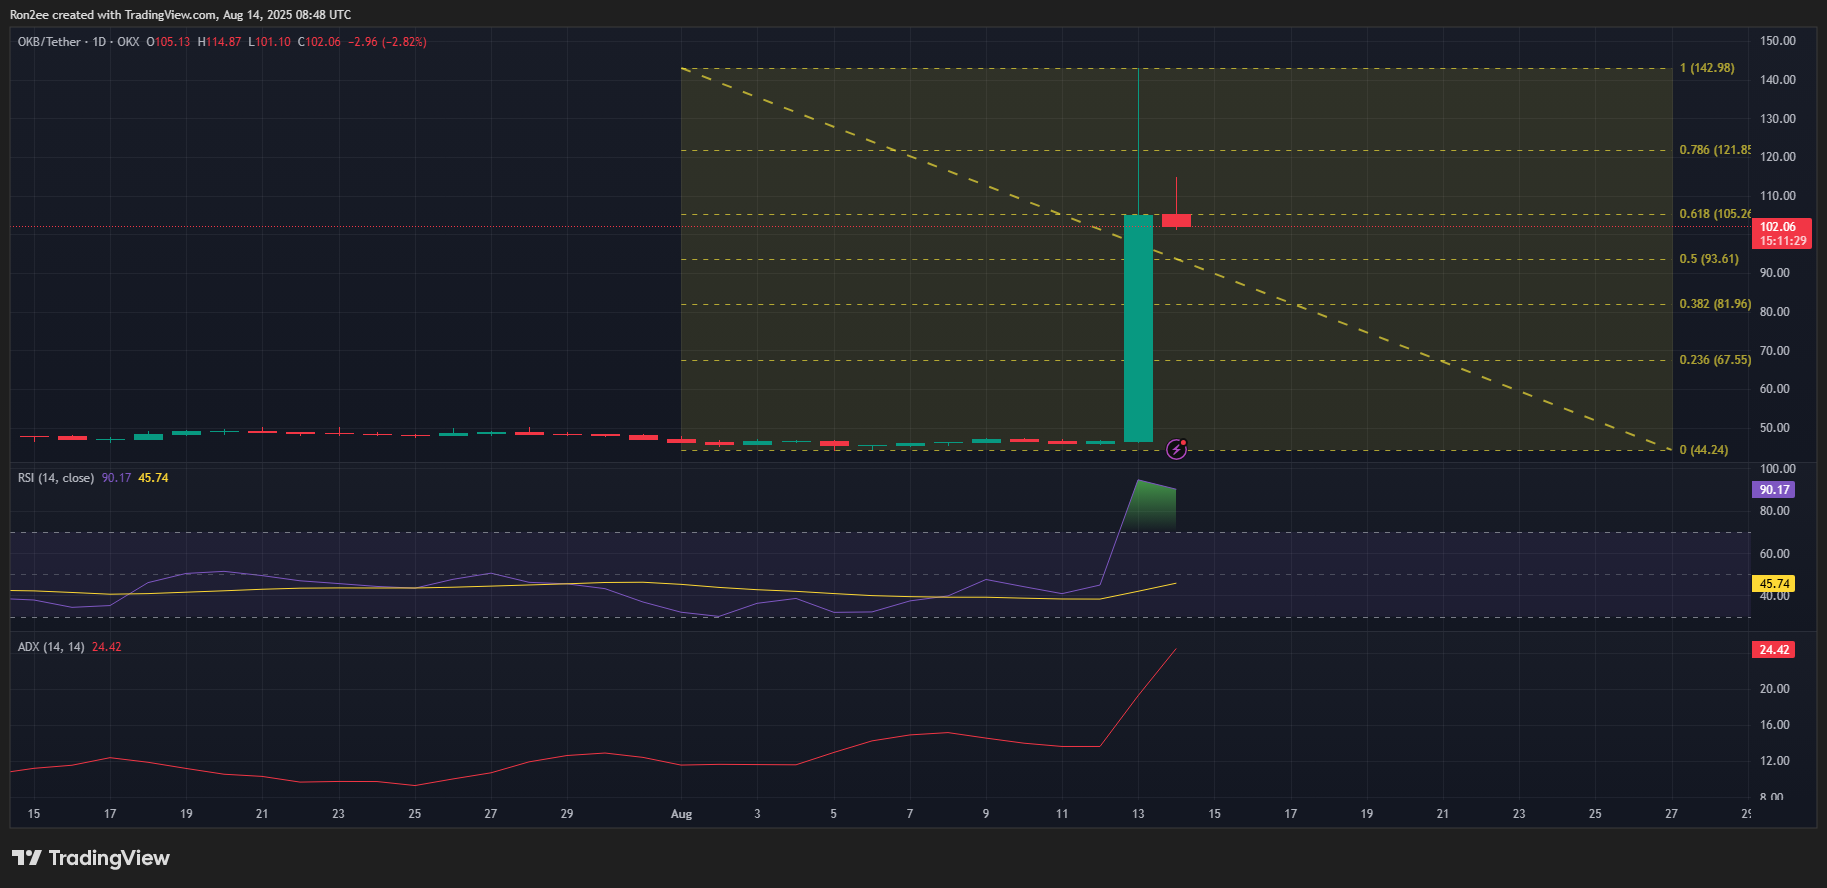
The Relative Strength Index has formed a bearish divergence after entering the overbought zone at 95 and subsequently declining to 91. While this marks a slight pullback, the indicator remains in extremely overbought territory, still signaling elevated risk of a correction.
The Average Directional Index currently stands at 24, suggesting that a potential reversal trend is developing but not yet at full strength. A reading above 25 would confirm that the reversal is gaining momentum.
Fibonacci retracement analysis identifies the next significant support at $81.96, corresponding to the 38.2% level. A decisive break below this level could open the way for a deeper decline toward $44.20, a key long-term support zone.
Conversely, if buying pressure emerges and OKB rebounds from $81.96, it could signal the start of another upward leg for the token.
The next few days will be critical in determining whether OKB can stabilize at higher levels or see its gains unravel once the post-rally momentum fades.
Disclosure: This article does not represent investment advice. The content and materials featured on this page are for educational purposes only.